
Blackstone’s BREIT has always been a creature of its time. Launched in 2017, the Blackstone Real Estate Income Trust promised retail investors institutional-grade property exposure with daily liquidity—a concept that sounded reasonable enough when cap rates compressed and the Fed’s balance sheet only moved in one direction. Then 2022 arrived, and the beast woke up. Redemption requests hit $5.3 billion in November 2022 alone. The gate came down. Investors who thought they owned something liquid discovered, abruptly, that they did not. That was the story. Until it wasn’t.
Now, the narrative has flipped. Net inflows have returned. Blackstone reports that new capital is coming in at a pace that outstrips the remaining redemption overhang—an 18% surge in buyer interest by some internal metrics. The fund has “stabilized,” according to the firm’s latest shareholder letter. The property market, we are told, has found its footing. But the question sitting in the back of every cycle-watcher’s mind is simpler, and less comfortable: is this real money, or is it performance chasing in a duration-sensitive asset class that hasn’t yet priced the full Fed path?
The Redemption Ghost Isn’t Exorcised—It’s Just Resting
Let’s be clear about what happened. BREIT didn’t solve its liquidity mismatch through asset sales alone. It solved it through a combination of gating, strategic capital calls from anchor investors (the University of California committed $4.5 billion in early 2023), and a quiet but decisive shift in the fund’s redemption policy toward quarterly limits and preferential treatment for new capital. The fund’s net asset value, while down from peak, has been managed down gradually—down 8.7% from its 2022 high, according to Blackstone’s own marks. Those marks, of course, are internal. There is no secondary market check. And that is precisely the point.
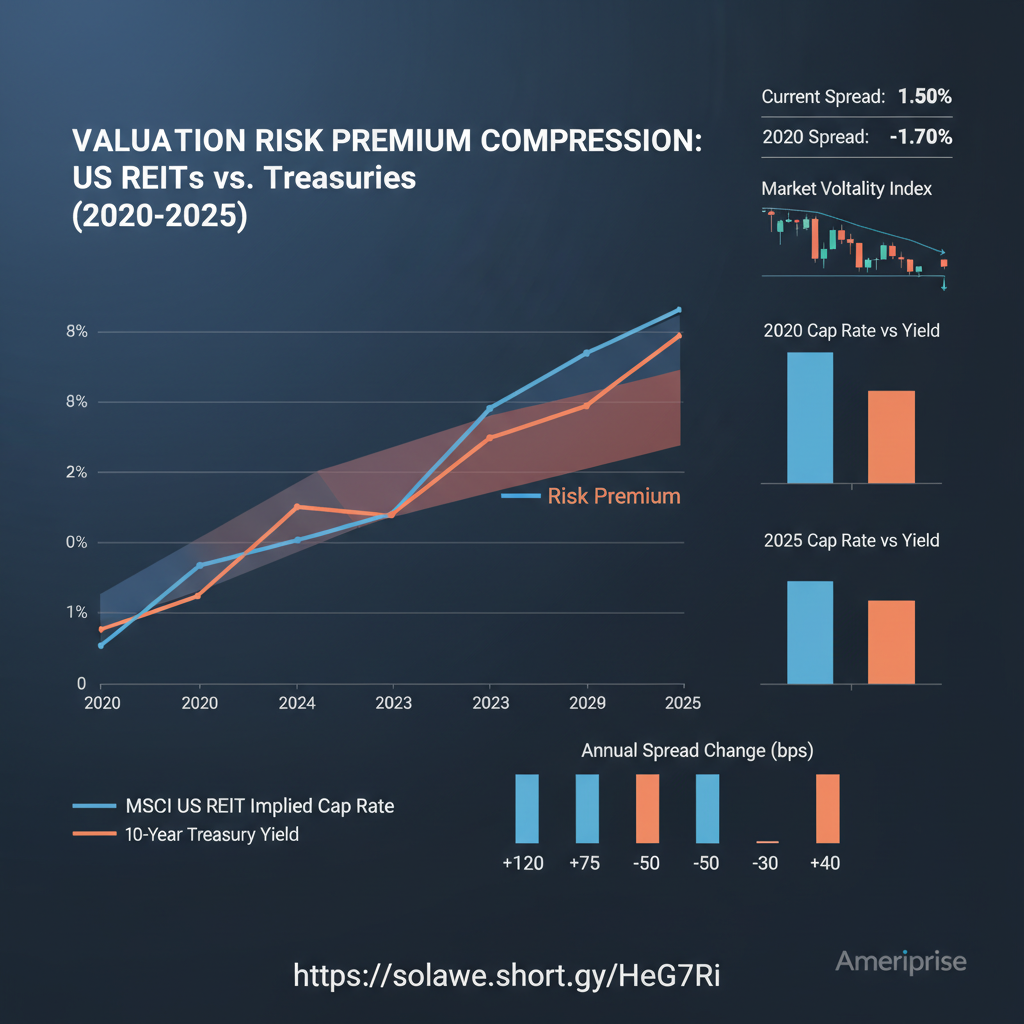
Property is not a price-quoted asset. It is a model-quoted asset. When Blackstone marks its industrial portfolio, it uses cap rates that move glacially compared to the 10-year Treasury’s violent repricing. The 10-year has swung from 1.5% in 2021 to over 5% in late 2023, and now hovers around 4.3%. CRE cap rates have moved, but not enough. The spread between MSCI’s US REIT Index implied cap rates and 10-year yields remains compressed by historical standards—tight enough to make any valuation-sensitive investor nervous.

And yet, the buyers are back. Why?
The 18% Surge Is Flowing From Familiar Places
The answer lies not in property fundamentals, but in cross-asset pricing mechanics. When the Fed paused rate hikes in mid-2023, and then pivoted dovish in December, duration-sensitive assets rallied indiscriminately. Long-term bonds had their best quarter in decades. Growth stocks, those proxies of long-duration cash flows, surged. And in that surge, a certain type of investor—call them the “Fed pause cohort”—began hunting for yield again. Not just any yield, but yield that felt tangible. Buildings, warehouses, data centers. Real things.
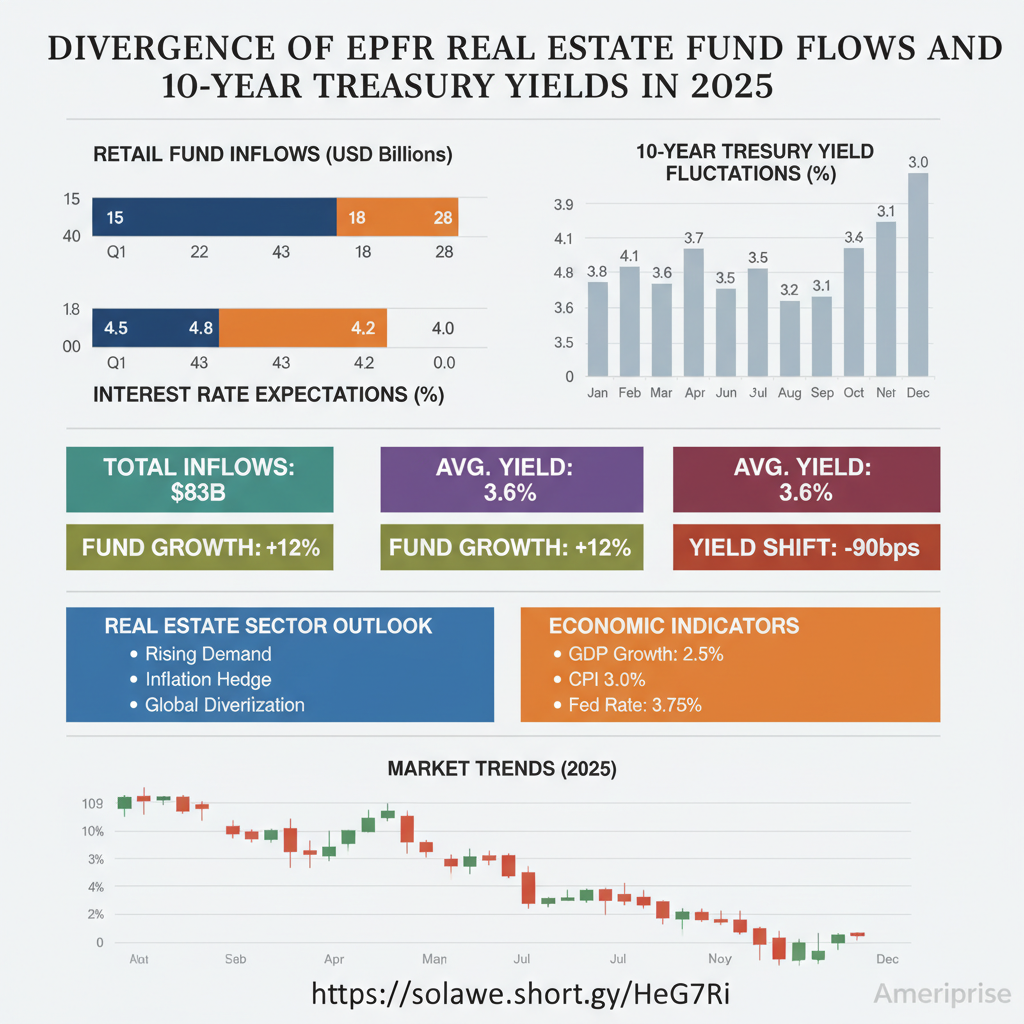
EPFR Global data shows a fascinating split. Institutional real estate funds saw outflows of $12.3 billion in 2023. But in Q1 2024, that reversed—$4.1 billion of inflows, with 60% coming from retail channels. This is not pension money rebalancing. This is individual investors, many of them first-time allocators to alternatives, moving cash from money market funds yielding 5% into property funds promising 7-8% distributions. The logic feels sound. The math, less so.
Here’s why. That 7-8% distribution is not a yield. It is a payment, often funded by leverage, asset sales, or simply return of capital. BREIT’s own documents show that 23% of its 2023 distributions were classified as “return of capital.” In a high-rate environment, that is a slow-motion liquidation, not income generation. But the buyer boom doesn’t seem to care. The Fed has paused, the soft landing narrative is dominant, and property feels like a safe harbor. Bloomberg’s latest fund flow survey confirms this sentiment shift: real estate went from the most hated sector in October 2023 to the third-most favored by March 2024, a rotation of stunning speed.
Macro Gravity Hasn’t Been Repealed
Of course, the Fed hasn’t actually cut yet. The dot plot says three cuts in 2024. The market prices in six. Someone is wrong. The BLS’s latest JOLTS data—9.5 million job openings in February, down from 12 million in 2022—suggests the labor market is cooling, but not collapsing. Wage growth is decelerating toward 4% year-over-year. That’s still too hot for a 2% inflation target, but cool enough to keep the soft landing dream alive. The question is whether property valuations have priced in the possibility that the dream dies.
Consider the duration risk. A typical industrial property might trade on a 5% cap rate. If the risk-free rate is 4.3% and credit spreads are 150 basis points, that cap rate implies almost no risk premium. A 50-basis-point upward shift in the 10-year, which could happen if inflation re-accelerates, would require a 10% price decline to maintain the same spread. That is the hidden leverage in real estate—it is not on the balance sheet, but in the valuation model. And models change fast when liquidity evaporates.
The CFTC’s commitment of traders report shows speculative positioning on 10-year Treasury futures is net short, but barely. The rates market is not priced for a hawkish surprise. Neither, it seems, is BREIT’s buyer base. Reuters reported last week that institutional investors remain underweight CRE, with average allocations 200 basis points below target. The 18% buyer boom is not coming from the smart money. It is coming from the yield-starved, the late-cycle allocators, the ones who always show up just before the music stops.
Energy and Tech Tell a Different Rotation Story
While real estate attracts retail flows, institutional capital is rotating elsewhere. The energy sector, long abandoned, has seen 13 consecutive weeks of inflows according to EPFR, as oil stabilizes above $80 and capital discipline finally holds. Tech, meanwhile, is bifurcating. The mega-cap AI names—Nvidia, Microsoft—are absorbing liquidity like black holes, trading at forward earnings multiples that assume no cyclical downturn. But old tech, the Cisco and Intel of the world, is being re-rated as a defensive value play. This is not a monolithic risk-on rally. It is a precise, sector-specific rotation driven by duration sensitivity and earnings visibility.
Property sits awkwardly in this taxonomy. It is not defensive—office vacancies in San Francisco remain above 30%, a structural shift, not a cyclical one. It is not growth—rent growth is decelerating across multifamily and industrial. It is, at best, a yield play. But yield plays only work when rates are stable or falling. The Fed’s own Financial Stability Report, released in April, explicitly flags commercial real estate as a vulnerability, noting that $1.2 trillion of debt matures by 2025 and will need to be refinanced at much higher rates. That is not a tailwind. It is a wall.
And yet, the buyers come. CNBC’s latest retail investor survey shows 34% of respondents plan to increase real estate exposure in the next six months, the highest reading since 2021. The memory of the redemption crisis has faded, replaced by the more powerful memory of missed gains. This is how cycles work. The pain of losing money is acute, but the pain of watching others make money is chronic. It gnaws until you act.
The Trap Is Structural, Not Cyclical
So is the 18% buyer boom a trap? Yes, but not for the obvious reason. The trap is not that property values will collapse tomorrow. Blackstone’s portfolio is high-quality, well-located, and mostly current on debt. The trap is that investors are buying a liquidity illusion at the exact moment the macro environment is shifting against it. They are paying institutional prices for retail access, and they are doing so because the Fed’s pause has made them desperate for any asset that feels like it yields something real.
The real risk premium in BREIT is not in the cap rate. It is in the liquidity mismatch. And that mismatch has not been fixed. It has been papered over with gates, UC capital, and a marketing push that emphasizes “stabilization.” But stabilization is not appreciation. It is the absence of panic. And the absence of panic, in a world where the 10-year can move 30 basis points in a week, is a fragile thing.
Consider this: the IMF’s latest Global Financial Stability Report estimates that CRE prices need to fall an additional 15-20% to reflect current financing costs. The OECD’s commercial property leading indicator is flashing red in half its member countries. These are not headlines. They are footnotes in reports that most retail investors never read. But they matter. They matter because they tell you where the smart money is hiding, and it is not in daily liquidity property funds.
The buyer boom will continue until it doesn’t. It will stop when the Fed actually cuts and the 10-year rallies, revealing that the real trade was always duration, not property. Or it will stop when the Fed doesn’t cut, and the cap rate math becomes impossible to ignore. Either way, the investors coming in now are not being paid for the risk they are taking. They are being sold a story. And stories, unlike buildings, can disappear overnight.
Blackstone’s beast is tame for the moment. But beasts have a way of remembering their nature.
For investors building a systematic framework, the BREIT saga offers a case study in liquidity illusion and duration risk. If you want to understand how institutional managers are actually repositioning across real assets, rate sensitivity, and sector rotation, the underlying flow data and policy signals matter more than headlines. This breakdown of cross-asset positioning and Fed sensitivity analysis maps the institutional logic that retail flows are currently ignoring.