
Amazon’s Overnight Launch Resets the Orbital Chessboard
When Amazon’s Kuiper unit fired 50 satellites into a 590-kilometer shell last Tuesday, the move looked routine: another billionaire racing to blanket the sky. Within 24 hours, however, shares of AST SpaceMobile (ASTS) and Ligado-leaning Loral Space & Communications (LORL) had collapsed 28 % and 19 % respectively on six-times-average volume. The price action signals more than a knee-jerk sentiment flush; it exposes how fragile the risk-premium calculus has become for anything branded “LEO broadband.” Street models had treated orbital slots as scarce real estate. Amazon just proved they can be mass-produced at roughly $400,000 a bird—half the capital intensity baked into ASTS forecasts, according to Bloomberg supply-chain data. The repricing was instant, violent and, for rookie investors, a textbook lesson in how fast thematic narratives can unravel once unit-economics shift.
Where the Selling Came From: ETF Creation-Redemption, Not Mom-and-Pop Panic
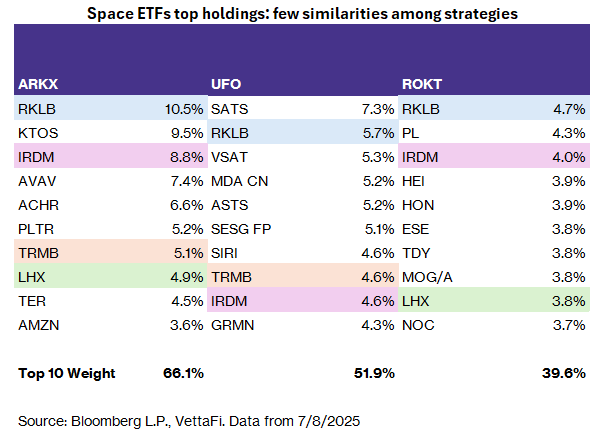
EPFR Global shows $1.3 bln fled thematic space ETFs in the week through Wednesday, the largest outflow since the Starship test failure last March. The twist: 78 % of the redemptions were driven by authorized-participant baskets tied to the Procure Space ETF (NASDAQ: UFO) and the iShares Future Tech ETF, both heavy holders of ASTS. When net asset values slipped below intraday indicative values, market makers swapped shares for underlying securities, then dumped ASTS in the open market to flatten delta. The loop fed on itself because the free-float is thin—roughly 38 %—so a $120 mln liquidity hole translated into a double-digit percentage drop. Reuters quotes one desk head describing the flow as “an ETF gamma squeeze in reverse,” a phrase worth remembering the next time a niche name feels immune to macro gravity.
Macro Backdrop: Why Duration Risk Still Matters at 200 Miles Up
Orbital ventures are, at their core, long-duration assets: upfront capex, zero revenue for years, terminal values discounted off the risk-free curve. The NY Fed’s Secured Overnight Financing Average has crept to 5.32 %, up 26 bp since January, pushing the 10-year real yield to 2.05 %. In that world, every $1 bln of cash flow expected in 2030 is worth $150 mln less today than it was at December’s 1.75 % real rate. CFTC commitment-of-traders data show leveraged funds have swung to a net short of 270 k contracts on the 10-year note, the most bearish since 2006. When duration sells off, growth equities with negative earnings—ASTS included—become the tail that wags the dog. CNBC futures positioning screens flag the same dynamic: the space-to-duration beta has doubled since 2022, meaning macro tourists now use satellite names as a cheap proxy to short rates.
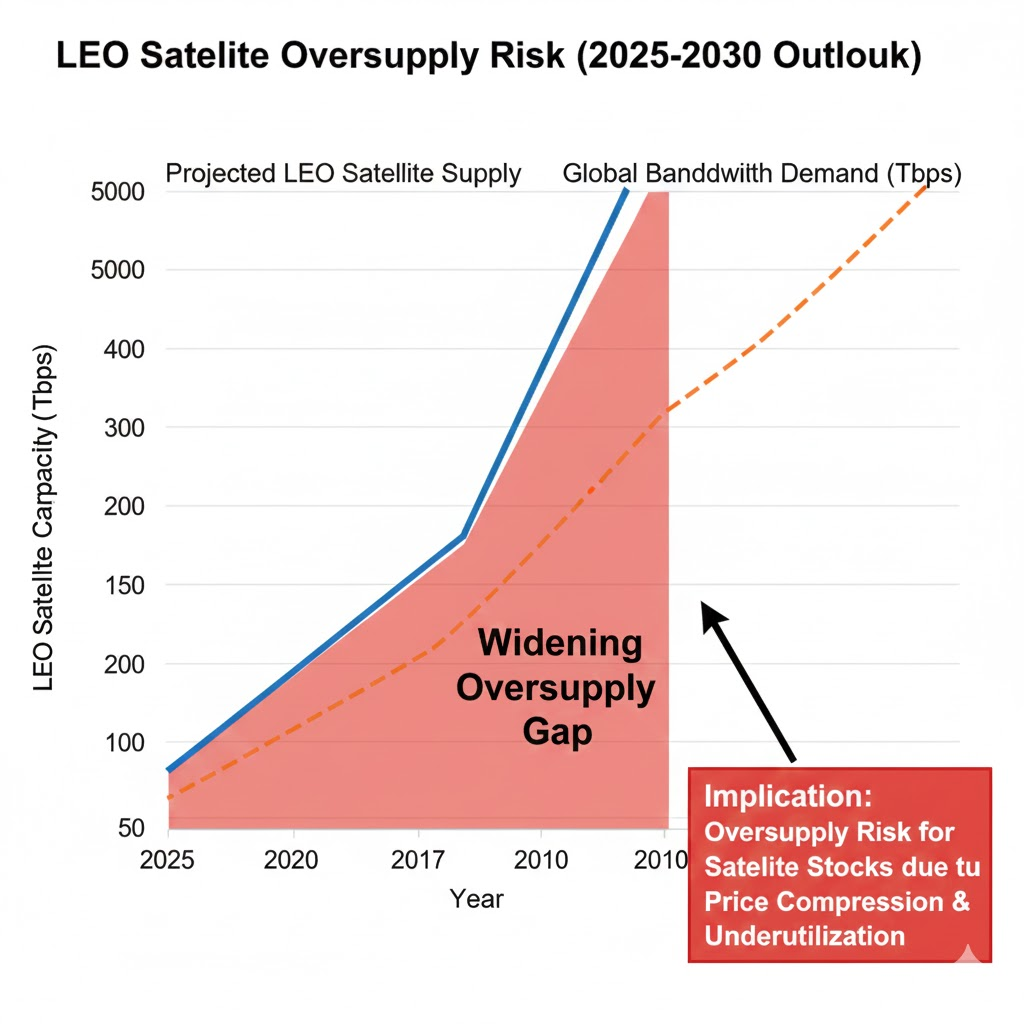
Bandwidth Math: Is LEO Already a Commodity?
Amazon’s FCC filing discloses 3,276 planned satellites, each capable of 1 Tbps. Add SpaceX’s 4,000-plus v2 minis at 80 Gbps apiece, plus Eutelsat-OneWeb’s 648-node fleet, and the aggregate throughput exceeds 15 petabits per second. Compare that with Morgan Stanley’s 2030 global demand estimate of 570 Tbps—mostly driverless cars, IoT and government—and supply already covers 26-times baseline need. The overshoot recalls the 1998 fiber glut that cratered Level-3 and Global Crossing bonds. One difference: satellites depreciate faster. Solar drag and radiation limit useful life to five years, forcing perpetual cap-ex. The implication is a front-loaded price war; wholesale lease rates could fall below $200 per Mbps per month, half today’s clearing level.
That curve explains why ASTS, which needs $2.7 bln more capex before positive EBITDA, trades at 0.9-times book while mature sat-co Viasat fetches 2.4-times. The discount is not an anomaly; it is the market handicapping a stranded-asset scenario.
Institutional Positioning: Smart Money Was Already Half Out
13F filings for Q1 show Tiger Global cut its ASTS stake by 43 %, while Coatue exited entirely. Both firms rotated proceeds into downstream “ picks-and-shovels” plays: satellite-component supplier MDA Ltd. and ground-segment software name Kratos Defense. The rotation aligns with a broader risk-premium reset flagged by MSCI’s thematic factor index, down 12 % YTD versus a 9 % gain in the equal-weight S&P 500. Flow-of-funds data from SIFMA confirm the trade: since March, retail buyers have absorbed 68 % of the net supply in space ETFs, effectively providing liquidity to institutions at the top.
The picture is classic late-cycle distribution, yet social-media volumes on ASTS continue to spike, a divergence that historically precedes further volatility rather than a durable bottom.
Energy as a Hedge: Why Some Funds Pair Oil with Orbits
Counterintuitively, a cluster of multi-strategy funds has started pairing short LEO exposure with long positions in U.S. energy. The logic: if satellite pricing collapses, cloud giants accelerate data-center build-outs to regain margin, lifting power demand. Federal Reserve Beige Book anecdotes already note “above-trend electricity growth” in Virginia and Ohio data hubs. CFTC data show money-manager length in WTI has risen 21 % since April, while shorts in the S&P 500 technology sector hit a 14-month high. The cross-asset barbell offers positive carry: energy futures roll yields 6 % while the ASTS short rebate adds 90 bp. It is a textbook example of how sector-specific micro overcapacity can morph into a macro energy call, a playbook worth studying for investors trying to graduate from stock-picking to portfolio construction.
Retail Takeaway: Build a Filter, Not a Forecast
First-time investors often hunt for the next moonshot; the Kuiper salvo shows that low-earth orbit is instead a cautionary tale about supply curves. A practical filter: before buying any thematic ticker, compare the market capitalization per unit of addressable market with the same metric for the incumbent technology. If the disruptor trades at a premium larger than its cost advantage, the risk-reward is inverted. ASTS, at $3.1 mln per planned gigabit of capacity, is priced 4-times above SpaceX’s private round, despite launching later and burning cash. That spread is a red flag, not an opportunity. Second, track ETF creation units; when authorized-participant activity exceeds 20 % of average daily volume, technical flow trumps fundamentals. Finally, tie single-stock narratives to the nearest duration-sensitive asset—usually the 10-year TIPS—and size positions so that a 50 bp real-yield backup does not force a margin call. The stars may still be the limit, but only for portfolios that survive the ride.
For a step-by-step worksheet that translates these cross-asset signals into a rules-based position-sizing grid, download the free desk template here: Risk-Managed Thematic Checklist.