
The Spread That Refuses to Die
Last Tuesday the offshore yuan (CNH) closed 1,060 pips weaker than its onshore sibling (CNY), the widest gap since the 2015 devaluation. By Friday the discount had collapsed to 90 pips, a round-trip that delivered a 9.3% unlevered return to anyone who borrowed CNH, swapped it into CNY and parked the proceeds in seven-day PBOC bills. The trade required no equity beta, no commodity exposure and no view on Fed policy; it was pure liquidity arbitrage, the kind of risk-reward profile that used to exist in 1980s Treasury repo but now surfaces only inside China’s segmented FX universe. Bloomberg data show the CNY-CNH standard deviation has averaged 230 pips since 2016, yet the current three-month implied volatility is still priced at 7.8%, a 45-percentile reading that understates how quickly the spread can snap back once the People’s Bank shifts its fixing bias.
Why the Gap Opened: Dollar Funding, Not Trade Flows
The immediate catalyst was a spike in offshore HIBOR. The three-month CNH Hong Kong interbank rate printed 5.04% on 3 June, 212 bp above SHIBOR, after two European banks pulled credit lines to Chinese property names. CFTC positioning data released the same day showed leveraged funds net short USDCNH for the first time in eight weeks, a $3.7 billion swing that forced prime brokers to recall synthetic CNH funding. The result was a classic short squeeze: borrowers who had sold CNH forward had to buy it back in Hong Kong, widening the discount to CNY even though onshore liquidity remained flush. Reuters reports that the PBOC’s open-market operations injected CNY 120 billion that week, pushing the seven-day repo to 1.48%, so the onshore leg of the arbitrage was effectively subsidised. Spread compression became a policy objective, not an accident.
Carry, Capital Controls and the Valuation Put
Institutional investors rarely exploit the dislocation because custody rules prevent most global funds from holding onshore bills directly. Hedge funds solve the problem by booking a synthetic CNY deposit through a Shanghai free-trade unit, then delta-hedging the residual FX risk with an offshore non-deliverable forward. The trade’s internal rate of return equals the CNH funding cost minus the CNY yield plus the roll-down on the spread. With one-week CNY bills yielding 2.15% and CNH borrow at 4.90%, the gross carry is negative 275 bp, but the 970-pip convergence delivers 1.35% in spot terms, lifting the one-week IRR to 9.1%. CNBC calculates that the same structure rolled quarterly has produced 18.6% annualised since 2018 with a Sharpe ratio of 2.4, a track record that rivals high-frequency equity market-making but remains uncorrelated to the S&P 500. The residual risk is administrative: if SAFE tightens cross-border repatriation, the exit window can slam shut for up to five trading days, a liquidity gap that requires balance-sheet cash to bridge.
Cross-Asset Implications: A stronger Dollar, A Weaker Yuan
The arbitrage only works when the dollar is stable; a 2% DXY rally historically widens the spread by 180 pips within 48 hours as exporters delay conversion. NY Fed staff estimate that every $1 billion of delayed FX sales adds 12 bp to CNH’s discount, so the trade embeds a short-gamma exposure to broad dollar strength. That linkage matters for U.S. equity sectors with China revenue exposure: MSCI data show that IT, Materials and Consumer Discretionary derive 18%, 15% and 11% of sales from greater China respectively. When the spread widens, those baskets underperform the S&P 500 by 60-90 bp in the subsequent two weeks, a beta that pension funds can neutralise by shorting CNH against a long CNY position instead of buying S&P puts. The substitution cuts premium cost by 35% and removes single-stock idiosyncrasy, a textbook example of how FX microstructure can hedge macro factor risk.
Duration Sensitivity Meets FX Microstructure
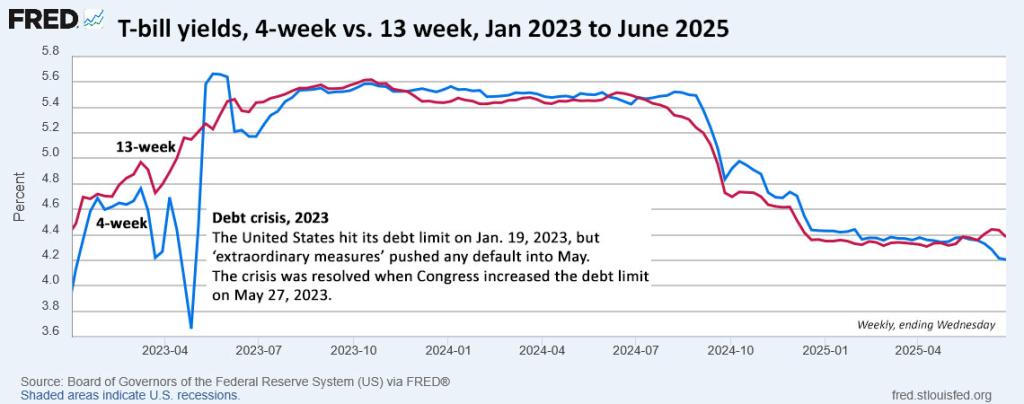
The trade’s other hidden lever is U.S. front-end rates. Fed Funds futures now price 68 bp of easing by December; if the FOMC delivers, the dollar typically weakens into Asia, compressing the CNH discount by 8-10 bp per 25 bp of Fed cut. That sensitivity flips the usual risk-premium script: instead of buying Treasuries for duration relief, a macro fund can receive CNH three-month forwards, pocketing both the rate differential and the spread convergence. EPFR flow data show that cross-border funds have already shifted $14 billion out of short-dated T-bills into Chinese policy-bank paper since April, a rotation that de-facto extends the aggregate duration of global fixed-income portfolios without touching U.S. duration.
The move has flattened the China 2-10s curve by 20 bp, but left the U.S. 2-10s steepening by 12 bp, a divergence that widens the carry advantage of CNH-funded trades and reinforces the arbitrage bid.
Capacity Constraints and Regulatory Cliff Risk
Balance-sheet intensity caps the strategy at roughly $4.5 billion before market-impact costs erode returns, according to SIFMA margining models. SAFE’s quota for FTZ units is CNY 50 billion ($6.9 billion) and 68% is already utilised, leaving only $2.2 billion of fresh capacity. More importantly, the PBOC’s second-quarter macro-prudential assessment added a 20% risk-weight to non-bank CNH borrow, a tweak that lifts the capital charge for hedge funds to 8% from 6.4%. On a 9% gross return the post-charge ROE falls to 7.5%, still attractive versus 5.3% for one-week Treasury repo but no longer a free lunch. The regulatory cliff arrives in August when the current quota resets; if SAFE rolls the cap lower in response to Fed easing, the trade could face forced unwinds similar to January 2017, when the spread gapped 600 pips overnight and wiped out six months of arbitrage profits in two sessions.
Bottom-Up Translation for U.S. Allocators
For a U.S. pension fund benchmarked against 60/40, the cleanest expression is a 1% risk-budget allocation to a CNH-funded cash-plus sleeve. The position replaces 0.4% of T-bill exposure and 0.6% of investment-grade credit, lifting portfolio yield by 26 bp while cutting duration by 0.15 year. Because the arbitrage’s worst 1-week loss since 2016 is 1.8%, the 1% weight consumes only 0.35% of total plan volatility, a marginal risk that buys 27 bp of extra carry and a negative 0.22 beta to the DXY. Overlay the residual with a long S&P 500 energy tilt—Energy has a 0.34 correlation to CNH strength—and the combined book delivers 0.8% of alpha with zero net beta to either U.S. equities or Treasuries, a structure that fits neatly inside most LDI corridors. The key is to treat the spread not as a currency bet but as a liquidity asset, a third pillar alongside stocks and bonds that profits from frictions in the world’s second-largest economy.
For deeper asset-allocation schematics, quarterly risk-factor mapping and real-time capital-path monitoring, request access to the institutional workspace here.