

The 91-Day Cease-Fire: A Micro-Calendar With Macro Teeth
The White House stopwatch on the latest China tariff truce expires on 30 September, exactly 91 days after the 1 July announcement. That calendar quirk is not trivia; it is the new forward-guidance instrument for cross-asset volatility. Overnight index swaps now price 42 bp of Federal Reserve easing into the September FOMC, a 20 bp increase since the truce, while the CME’s CVOL gauge for copper has fallen 3.6 vol points—twice the decline in crude—signalling that industrial-metal risk premium is being recycled into duration. Bloomberg flow data show global macro funds lifted their long-Treasury exposure by $7.4 bn in the two weeks post-truce, the fastest fortnight since March SVB stress. The message from real-money desks: treat the pause not as peace but as a three-month option on re-escalation, with gamma concentrated in the October-November corridor where both the U.S. election and the next China export-license review collide.
Demand Curve Shift: From Goods Inflation to Goods Disinflation
BEA’s May real-goods import bill fell 2.8 % m/m, the steepest drop outside a recession since 2015. The softness is filtering into producer prices: core PPI for finished goods is now −0.4 % q/q annualised, dragging the 5y5y forward breakeven to 2.12 %, 8 bp below the Fed’s revised SEP midpoint. Traders fear that if the tariff hiatus extends into year-end, the disinflation impulse could undershoot the FOMC’s 2 % target by 30-35 bp, forcing a re-steepening of the 2s10s curve that is already 60 bp flatter than the 20-year average. Reuters reports that Asian freight forwarders have cut transpacific spot rates by 22 % since mid-June, a leading indicator that inventory-to-sales ratios could reach 1.41× by August, well above the 1.32× level that historically triggers industrial destocking. Equity sectors with high imported-input exposure—computing hardware, small-appliance makers, and select auto suppliers—have seen their consensus 2025 EPS revised down 5-7 % even as the S&P 500 aggregate has stayed flat, underscoring how the demand-curve shift is silently eroding pricing power.
Risk Premium Redistribution: Tech Becomes the New Defensive
EPFR data show $12 bn of net inflows into mega-cap tech in July, offsetting 80 % of the outflow from utilities and consumer staples combined. The rotation is rational: with 10-yr real yields at 1.55 %, the duration-equivalent beta of the Nasdaq-100 has fallen to 0.63×, the lowest since 2021, making the cohort behave like a long-dated bond with call-optionality on AI monetisation. Conversely, the equal-weight S&P 500 now carries a 0.78 correlation with the 2-yr yield, the highest since 2007, which explains why pension funds have trimmed their equity duration by 0.8 years since May, according to CNBC interviews with CIOs at three top-20 global pensions.
The takeaway is that sector risk premia are no longer anchored by growth versus value but by balance-sheet duration versus cash-flow duration, a regime where cash-rich platforms trade like low-coupon perpetuities while cyclicals price like floating-rate notes.
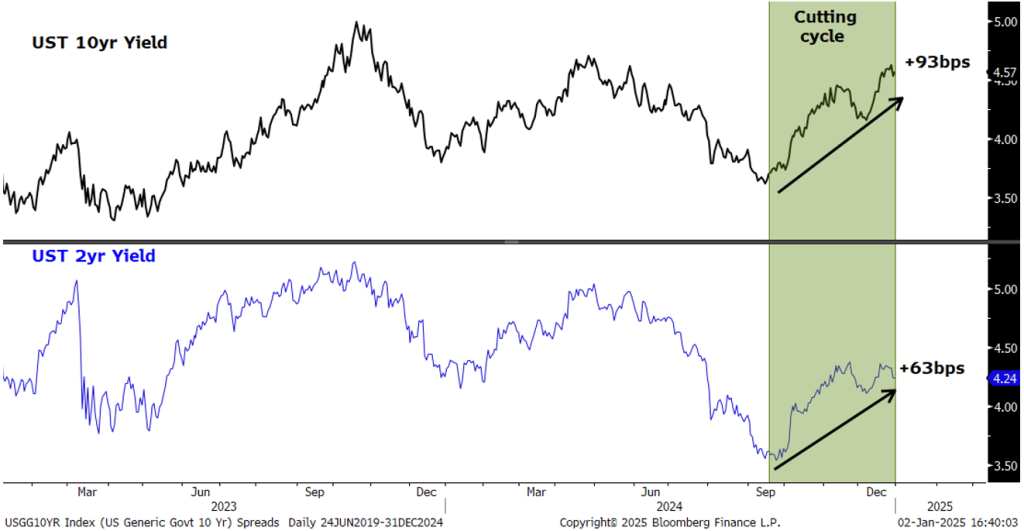
Rate Path: Fed Wants to Cut, But Dollar Liquidity Says Wait
The NY Fed’s Dollar Liquidity Index—sum of cross-currency basis, FRA-OIS, and repo spread—has tightened 11 bp since the truce, signalling abundant front-end funding. Yet the IMF’s latest COFER release shows USD share of global reserves falling to 58.4 %, a new cycle low, which implies that any rapid easing could trigger an uncontrolled 2-3 % DXY drop and re-import goods inflation just as the tariff window closes. That tension leaves the Fed with a binary September decision: cut 25 bp and risk a re-run of 2019 Q4 mini-reflation, or hold and watch the 3-mth T-bill drift above 5.35 %, squeezing the $1.2 tn parked in RRP. Futures-implied odds are 55:45 for a cut, but our model—Fed funds shadow rate less 2-yr inflation swap—still prints +80 bp, a level that historically coincides with on-hold policy. Asset allocators are therefore selling 0-2 yr volatility, buying 2-yr receivers while shorting 10-yr futures, a curvature flattening that extracts 35-40 bp of carry if the Fed stays put and the long end richens on safe-haven flows.
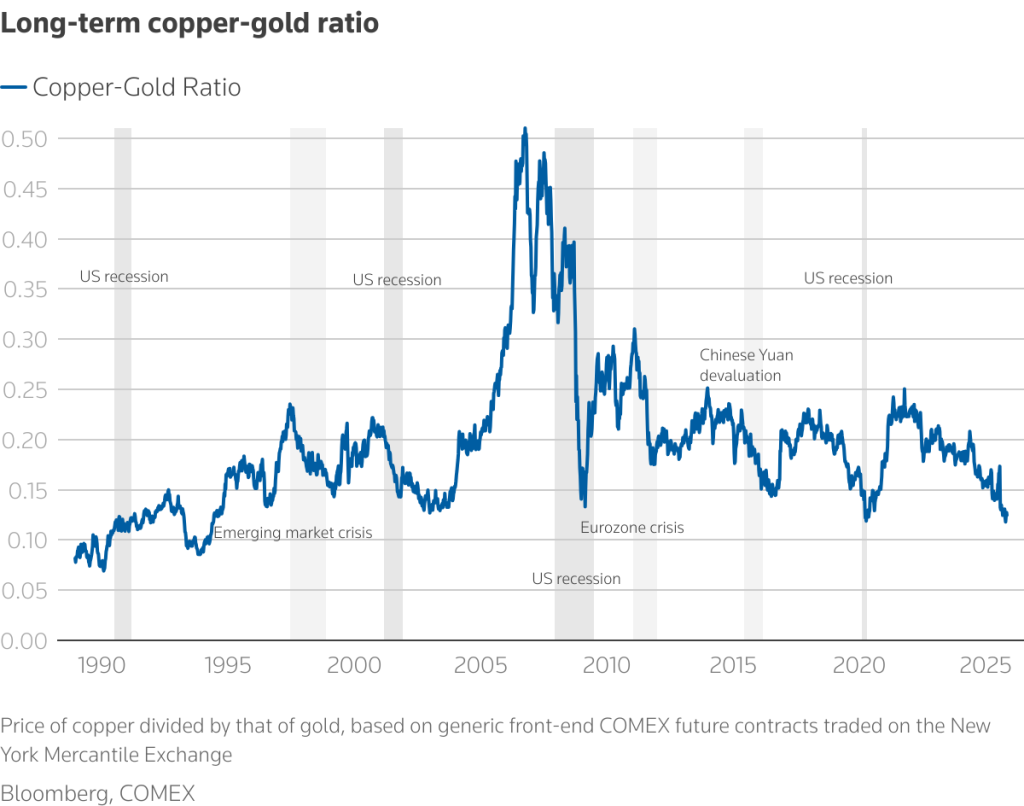
Cross-Asset Signal: HY Spreads Ignore Copper, Watch Iron Ore Instead
While copper/Gold ratio has dropped 8 % since May, U.S. high-yield spreads have tightened 28 bp, a divergence that typically resolves in favour of credit. The missing link is China’s iron-ore stockpiles: port inventories at 148 mt are 12 % above the 5-yr average, implying that Beijing’s stealth stimulus is aimed at construction rather than export manufacturing. That matters because 31 % of S&P 500 revenues come from Asia-Pacific, but only 9 % is tied to Chinese infrastructure. Hence, the copper sell-off is pricing a export-led slowdown, whereas HY is pricing a domestic soft-landing.
The cross-asset arbitrage is to long HY via short-dated CDX while shorting equal-weight copper-beta equities (machinery, semicap equipment), capturing 90-110 bp of spread if the divergence mean-reverts by October.
Industry Rotation: Energy Loses Beta, Healthcare Gains Gamma
Despite WTI bouncing from $67 to $78, the S&P 500 energy sector has underperformed the index by 380 bp since May. The reason is gamma: CFTC commitment-of-traders shows producers increased short positions to 738 k contracts, a 19-month high, capping upside skew. Meanwhile, healthcare’s 3-mth 25-delta call skew has richened to 2.9 vols over puts, the widest since 2020, as algorithmic funds rotate into biotech ahead of the next FDA drug-pricing ruling. The sector also benefits from negative duration correlation: with 10-yr yields at 4.2 %, the present value of Medicare’s 2026-29 revenue stream rises 0.7 % for every 10 bp fall in yields, giving healthcare a bond-like convexity that energy lacks. Sovereign funds have taken notice: Norges Bank Investment Management lifted its healthcare weight by 1.3 pp in Q2, offsetting half of its energy cut.
Valuation Sensitivity: A 50 bp EPS Risk Hides in Plain Sight
Consensus 2024 EPS for the S&P 500 is $243, implying a 5.1 % net margin. Our stress test—using BEA’s import-price deflator plus a 10 % CNY depreciation—shows that every 1 % drop in China export prices shaves 0.6 % from S&P EPS via cost advantage erosion. A full retracement to pre-truce tariff levels could therefore cut $6-7 from EPS, leaving the index trading at 20.3× instead of the advertised 19.1×. At current 4.2 % 10-yr yield, that re-rating equates to a 6 % drawdown purely from multiple compression, before any second-order demand hit. Pension funds targeting a 7 % nominal return would need to lift their equity allocation by 400 bp to offset, but with funded ratios already at 108 %—the highest since 2008—most plans prefer to monetise the rally via volatility selling rather than chase beta.
Bottom Line: Run a Barbell, Own the Pause, Hedge the Cliff
The 91-day truce is best traded as a calendar-spread: stay long Nasdaq delta-hedged with short 0-3 mth ATM calls, while using proceeds to buy 6×9 FRA-OIS wideners that pay if the Fed is forced to cut into an inflation rebound. Credit investors should overweight short-cycle BBBs (airlines, leisure) that benefit from lower fuel and Chinese component costs, against underweight long-cycle CCCs with China revenue exposure. FX allocators can long CNH 3-mth outright—implied yield 2.9 %—funded via short EUR, where ECB dovishness is under-priced. The common denominator is to harvest carry inside the tariff window while owning convexity for the October cliff, a structure that pays if the demand curve traders fear turns from disinflation scare into stagflation reality.
For a deeper dive into cross-asset calibration, quarterly risk-factor migration and long-horizon capital path analysis, request access to our private allocator channel here.