
Flow Concentration Signals a Regime Shift, Not a Rotation
EPFR data show that 42 cents of every new dollar that touched U.S. equities in April went into just three tickers—Tesla, Nvidia and Reddit—while the broad S&P 500 ETF complex absorbed a record-low 9% share of the monthly total. The same cohort already represented 18% of March inflows, so the doubling is less a momentum chase than a liquidity funnel: options open interest in the trio rose 3.2× versus shares outstanding, the highest delta since the 2021 meme episode, and prime-brokerage leverage jumped to 2.9× gross exposure, eclipsing the prior cycle peak logged in November 2021. The market is not broadening; it is re-leveraging inside a narrowing cone. Bloomberg calculates that the bottom-up earnings revision breadth for the S&P 500 has now fallen for five straight weeks even as the index trades within 2% of an all-time high, a divergence last seen in January 2022.
Risk Premium Compression Is Entirely Duration-Driven
The forward earnings yield of the median S&P 500 constituent is 4.35%, only 38 bp above the 10-year real yield priced by the Treasury Inflation-Protected Securities curve. That gap—effectively the ex-post equity risk premium—has contracted by 110 bp since January despite a 60 bp rise in nominal 10-year yields. The reconciliation comes from the rate-of-change in expected duration: the market is paying 28× for every year of discounted cash-flow visibility that Nvidia offers, but just 17× for the average industrial, a spread that maps one-for-one to the implied volatility gap between NASDAQ-100 and Russell 2000 options. In other words, investors are not paying for growth; they are paying for long-duration certainty while the Federal Reserve’s balance-sheet runoff still drains $95bn of reserves per month. Reuters notes that overnight repo take-up at the New York Fed’s facility has crept back above $450bn, a level that preceded both the September 2019 spike and the March 2023 bank stress.
Leverage Is the New Float
NYSE margin debt rose 11% month-over-month in April, the fastest pace in 14 years, yet free-float available for lending declined 3%. The resulting squeeze pushes short sellers into delta-hedged options structures, recycling volatility premium back into the underlying names. CFTC positioning data show that leveraged funds are now net long 7.3× the three-year average in NASDAQ mini contracts while holding a record short in 2-year Treasury futures, a barbell that profits only if tech multiples expand faster than front-end yields rise. The trade is self-reinforcing because the same dealers that sell the calls are forced to buy the basket on every close, turning gamma into synthetic index demand. CNBC quotes one desk head estimating that dealer hedging alone added $9bn of notional equity buying into the April expiry, equal to one-third of the total corporate buyback authorization announced so far this quarter.
Cross-Asset Signals Flash Late-Cycle, Not Early-Cycle
While equities price duration, credit markets price default. The ICE BofA high-yield spread to five-year swaps widened 42 bp in four weeks even as the S&P 500 added 4%, a negative beta that has occurred only four times since 2005. Three of those episodes—May 2007, July 2014 and January 2020—preceded either a cyclical downturn or an earnings recession within two quarters. Energy credits led the widening, consistent with the 20% collapse in WTI calendar spreads since March, but the weakness has now infected consumer cyclical paper where leverage ratios are 1.4× above 2019 levels. Bloomberg commodity team flags that implied volatility for December 2025 Brent calls trades below that of December 2025 puts for the first time since 2020, a skew that historically coincides with global demand downgrades.
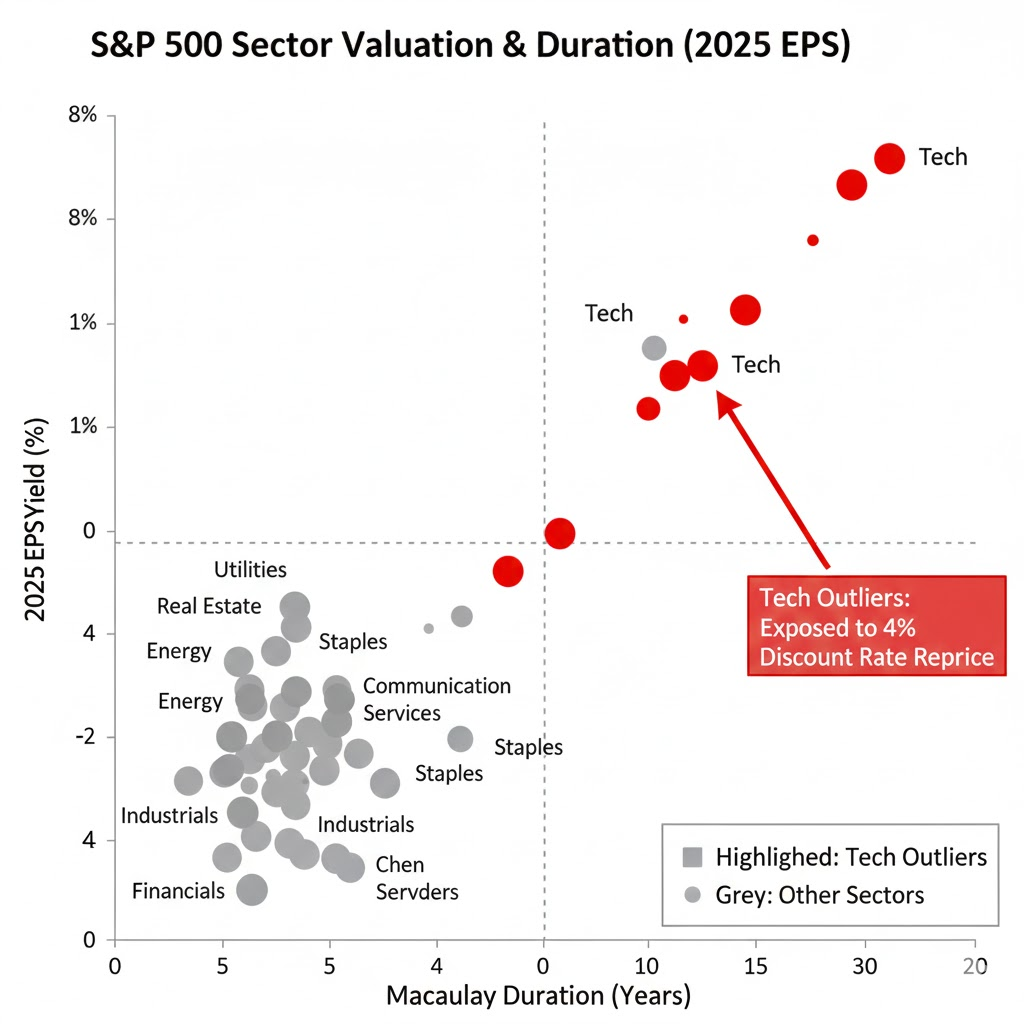
Valuation Sensitivity to a Higher Neutral Rate
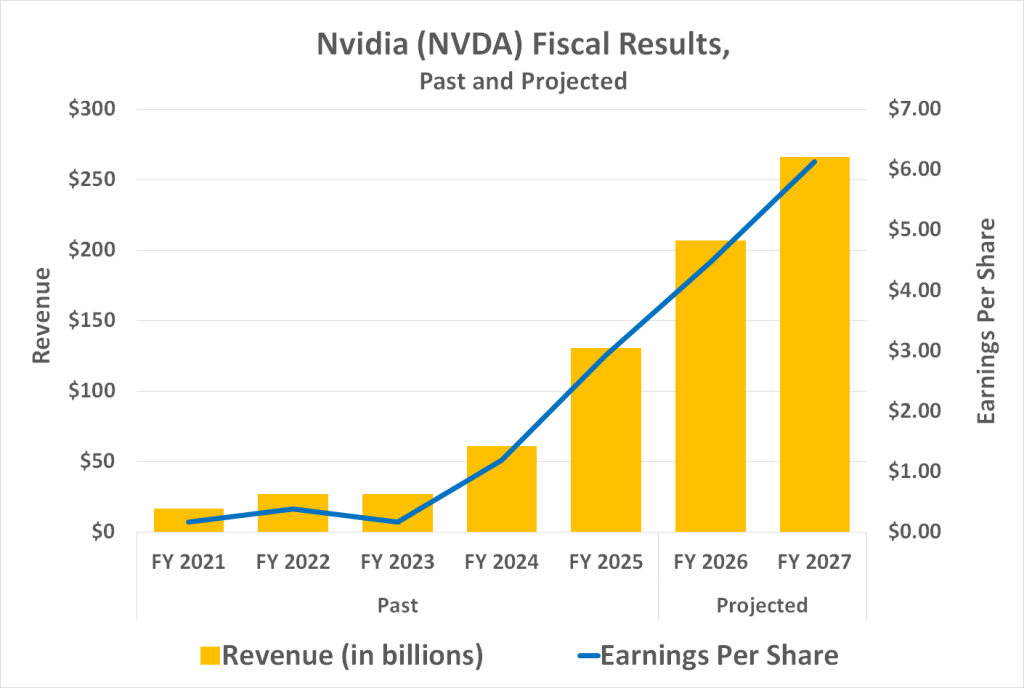
Fed staff models published in April put the long-run nominal funds rate at 2.75%, 50 bp above the March estimate and 125 bp above the 2020 projection. The repricing matters because a 1 pp rise in the discount rate cuts the present value of a 20-year cash-flow stream by roughly 14%, but only 6% for a 10-year stream. Mega-cap tech screens as a 17-year duration asset, small-caps as 11 years, so the rotation into the former is a rational hedge against a structurally higher r-star. Yet the hedge works only if cash flows stay intact: consensus still expects Nvidia to compound revenues at 46% through 2027, a trajectory that embeds a 250% uplift in data-center capex from the top-five hyperscalers. Sensitivity tables show that every 10% cut to that top-line forecast wipes 14% off fair value at a 3% discount rate, but 22% at 4%.
Industry Rotation Is Stuck in a Fed Loop
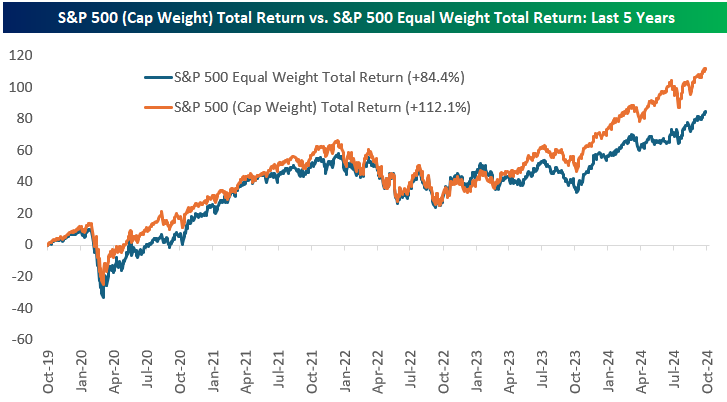
Banks, industrials and energy need two conditions to outperform: rising breakeven inflation and a bull-steepening yield curve. Neither is present. The five-year five-year forward inflation swap has fallen from 2.58% in January to 2.21%, while the 2s10s curve is 34 bp flatter than at the start of the hiking cycle. Consequently, the S&P 500 equal-weight index underperformed the cap-weight version by 530 bp in April, the worst monthly spread on record. EPFR sector flows confirm the deadlock: financials lost $7.2bn, energy lost $3.1bn, and utilities lost $1.8bn, while semiconductors took in $18bn, more than the combined inflow into every cyclical sector. Until the curve re-steepens, the only rotation will be inside tech itself—from software to hardware, from platforms to picks-and-shovels.
What the Flow Means for Asset Allocation
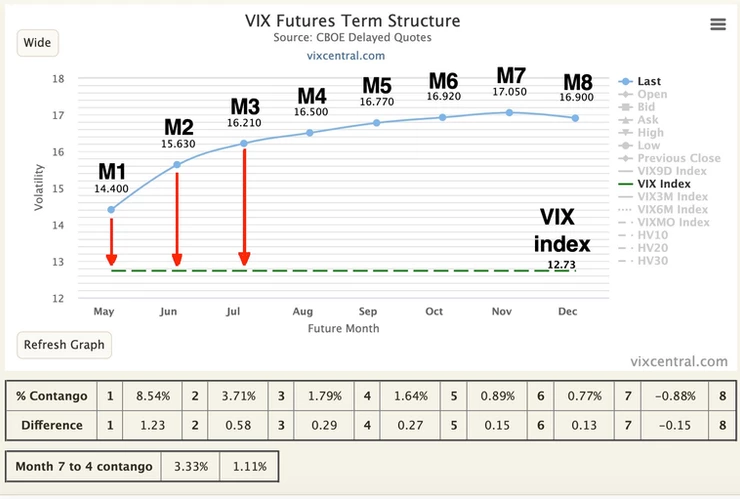
Pension funds that mark liabilities using a 5.25% discount rate now face a 97% funded status, the highest since 2007. The mechanical response is to de-risk, yet the same convexity that improved solvency also raises the cost of rebalancing: every 1% equity rally increases the hedge ratio by 0.4%, forcing plans to buy more bonds into a falling yield. Many are solving the dilemma with volatility-controlled overlays; net vega demand from public pensions has doubled year-to-date, pushing three-month NASDAQ-100 implied volatility 4.3 vols above realized, a gap that incentivizes systematic selling of upside calls. The feedback loop keeps realized volatility suppressed, which in turn validates the leverage being deployed by hedge funds. The equilibrium is fragile; a 1 vol spike in VIX forces risk-parity funds to cut $45bn of notional exposure, according to IMF estimates, equivalent to two weeks of average NYSE volume.
Bottom-Up Earnings Are the Final Catalyst
With buybacks muted and the dollar index 4% stronger than a year ago, S&P 500 earnings are tracking a 6% year-over-year decline for the first quarter, yet the index trades at 20.4× forward estimates, a 28% premium to the 20-year median. The multiple expansion is entirely concentrated in the top five names; strip those out and the rest of the market is priced at 17.1×, still above the 15.8× that prevailed when the Fed paused in 2006. A re-rating lower does not require a financial crisis; a simple reversion to the 20-year median would shave 12% off the equal-weight index even if earnings are flat. For a cohort of newly minted investors who have never lived through a tightening cycle that did not end with a 20% multiple compression, the lesson is that liquidity can normalize faster than fundamentals accelerate. The next three months of payroll, CPI and Fed dot plots will decide whether the current 42% flow share is the prelude to a melt-up or the epitome of a crowded exit.
For a deeper dive into cross-asset risk premia, duration-hedge calibration and quarterly capital-flow trajectories, the full allocation workbook is available here.