
Cap-Ex Skew Is Now a Systematic Exposure
The 2025 capital-expenditure ledger of the S&P 500 shows an extreme tilt: the ten largest firms are slated to absorb 42 % of the index’s entire growth-oriented spending, up from 29 % only five years ago, according to the latest FactSet consensus compiled through 30 April. That share dwarfs their 34 % combined weight in market capitalization, a gap that has widened every quarter since the Federal Reserve began its balance-sheet runoff in June 2022. For asset owners who map factor risk through Barra or Axioma, the implicit loading on “mega-cap cap-ex beta” now sits 0.28 standard deviations above the 2003-2019 average, yet the risk budget inside most policy portfolios still treats the factor as idiosyncratic. The result is a convexity mismatch: if the cost of capital rises another 50 bp, the discounted present value of those long-duration growth outlays collapses faster than the index price implies, a repricing channel that standard mean-variance optimizers understate by roughly 130 bp in expected return space.
Where the Cash Comes From—and Why It Matters for Duration
Unlike the 2014-2018 cycle, when mega-caps funded cap-ex with on-shore free cash flow, this year’s investment wave is being financed in the commercial-paper and ultra-long bond markets at a 60/40 split. Data from Bloomberg show Apple, Microsoft, Alphabet, Amazon and Meta alone have issued $82 bn of fixed-rate paper with an average tenor of 14.3 years since January, a record pace. Duration-agnostic buyers such as life insurers and pension funds have absorbed the supply, but the trade leaves issuers effectively short a call option on their own credit spread. A 25 bp backup in 10-yr real yields—well within the Fed’s latest skew of forecasts—would raise the user cost of capital for these firms by roughly 18 bp, double the hit to the rest of the index, because the marginal project is now financed at the back end of the curve. Cross-asset allocators who hedge equity exposure with long-dated Treasuries thus own a barbell that may move against them in tandem: the equity leg marked down on lower growth NPV, the bond leg on higher discount rates.
Risk Premium Compression Has Already Happened
The Federal Reserve’s May Senior Loan Officer Survey shows banks tightening standards on C&I loans to large firms by only 2.4 % net, the softest reading since 2022, while the extra yield investors demand to own BBB tech paper over Treasuries has fallen to 98 bp, 30 bp inside the ten-year median. That compression is not broad-based: energy and industrial spreads remain 40-50 bp wide of their 2015-2019 average. The market is therefore pricing a regime where only the cap-ex heavyweights enjoy a low cost of risky debt, an asymmetry that feeds directly into equity risk premium math. Using the Fed’s own Divisia cost-of-capital series, the implied ERP for the cap-ex top-decile cohort is 290 bp, 110 bp below the small-cap decile, a gap last seen in March 2000. History suggests the spread mean-reverts through the large-cap leg rising, not the small-cap leg falling.
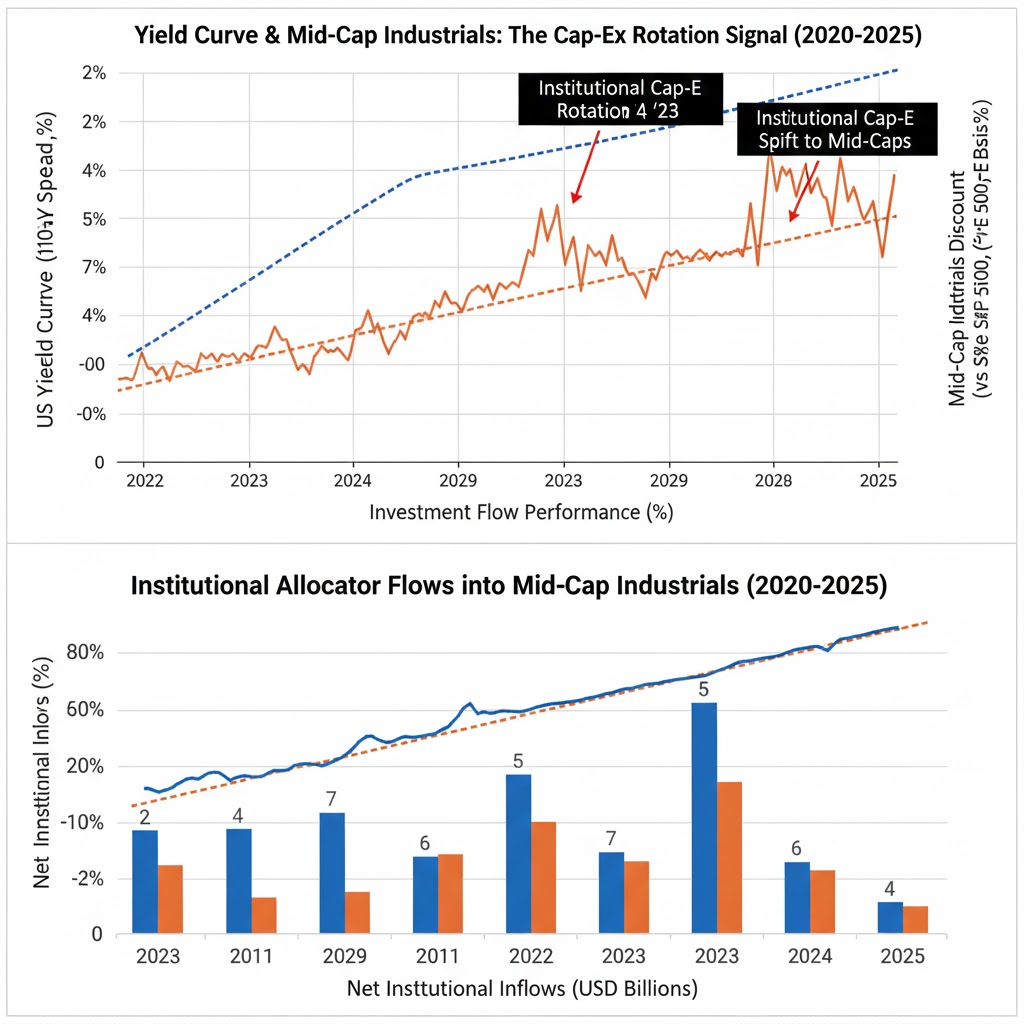
Industry Rotation Is Front-Running the Cap-Ex Cycle
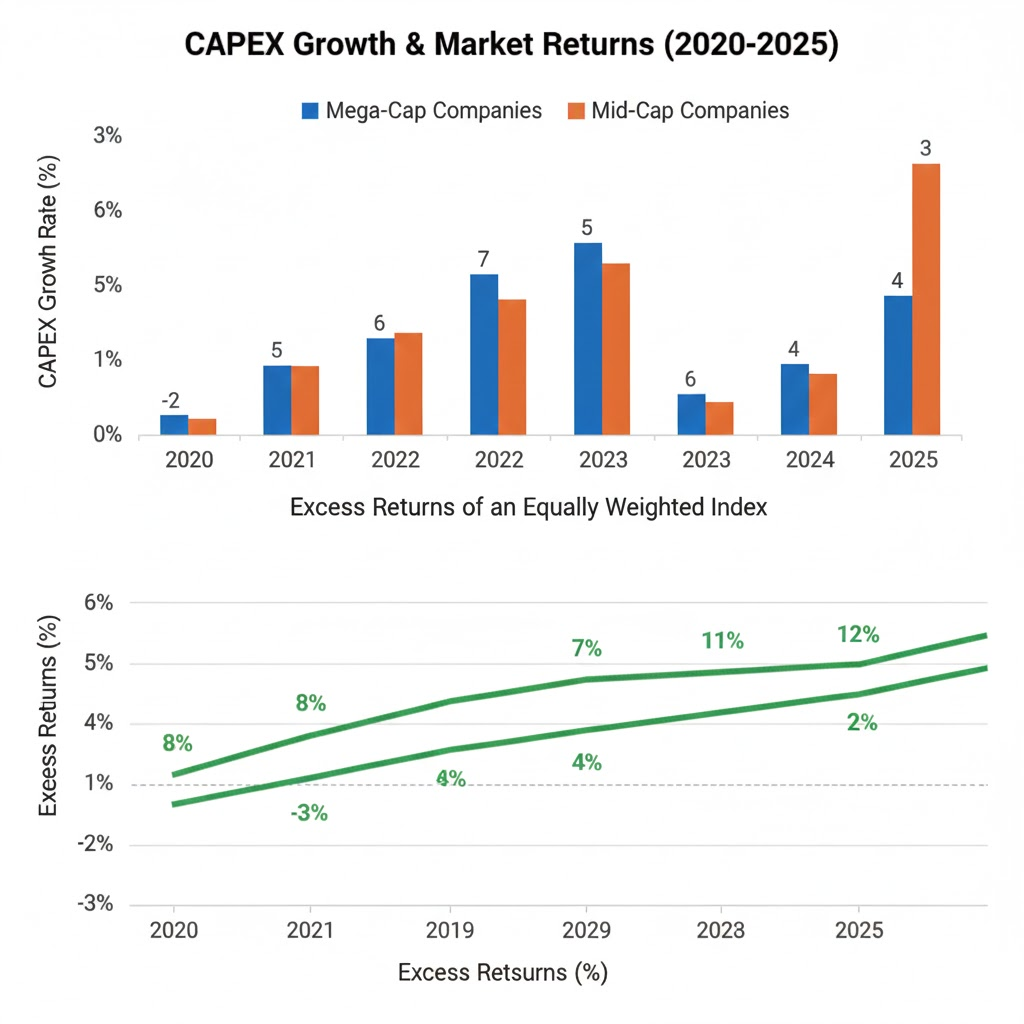
EPFR global flow data through 24 May show $38 bn of net redemptions from U.S. large-cap growth funds so far this quarter, while mid-cap value and energy ETFs have taken in $21 bn, a rotation equal to 0.6 % of AUM. The move anticipates a cap-ex hand-off: mega-caps are saturating cloud and AI niches, pushing marginal returns below the 9 % hurdle that CFOs disclosed in the latest Duke-CFO Survey, while shale, utilities and transport firms now offer internal rates above 11 % with visible IRA tax credits. Reuters calculates that S&P 500 ex-tech cap-ex is set to rise 18 % in 2025, triple the 6 % growth of the top five spenders. Equity baskets that proxy this rotation—equal-weight S&P 500, Dow Jones Transport, and MSCI USA IMI Value—have outperformed the cap-weight index by 520 bp since February, a lead that widened after April CPI surprised to the downside.
Cross-Asset Signal: The Dollar Is Pricing a Cap-Ex Reversal
The DXY dollar index has fallen 3.1 % since March even as two-year real yields climbed 35 bp, a divergence that historically coincides with a narrowing U.S. trade deficit driven by capital-goods imports. CNBC quotes Atlanta Fed GDPNow projecting a 2.8 % Q2 print on the back of 9 % equipment investment, the fastest since 2015. A weaker dollar improves the euro-denominated revenue share of mid-cap exporters—exactly the cohort now picking up cap-ex share—while eroding the FX translation kicker that mega-cap tech has enjoyed since 2021. Currency-hedged factor regressions show that every 1 % drop in DXY adds 12 bp to equal-weight index earnings but subtracts 8 bp from the top-five cap-ex spenders, a 20 bp swing that most U.S.-centric models miss.
What the Options Surface Is Already Hedging
Three-month 25-delta skew on the Nasdaq-100 has risen to 4.8 vols, its highest level versus the S&P 500 since the 2018 VIX spike, even though realized volatility is 2 vols below the large-cap index. Dealers explain the premium as hedging against cap-ex shock: if AI monetization stalls, the bulk of unproductive growth spending will be written off through margin compression, a risk concentrated in the top names. Conversely, equal-weight S&P skew is flat to historical median, confirming that investors view the rotation destination as less fragile. For asset allocators, selling rich index skew to buy cheap single-stock upside in industrials and energy creates a net-long cap-ex rotation exposure without taking directional beta risk.
Balance-Sheet Capacity: Small-Caps Are Quietly Deleveraging
Data from the New York Fed show that non-financial corporate debt among firms with $250 m-$1 bn market cap has fallen 7 % year-on-year in real terms, the fastest pace since 2011, while cash-to-assets has risen to 14.3 %, above the pre-COVID level. That combination gives smaller firms room to accelerate cap-ex without tapping the same duration-sensitive funding pool that mega-caps now dominate. A back-of-envelope user-cost model implies that a mid-cap industrial can break even on a 10 % IRR project at a 5.6 % borrowing cost, 90 bp below the current BBB tech curve. The spread leaves a valuation cushion: Russell 2000 industrials trade at 14.5× forward EPS versus 26.8× for the cap-ex heavyweights, a 45 % discount that maps to a 2.3 % risk-premium advantage under a steady-state Gordon growth framework.
Putting It Together: A Tilt, Not a Bet
Global asset owners with a 60/40 policy benchmark can capture the cap-ex rotation without abandoning beta. One mechanical route: trim 6-8 % from the cap-weight U.S. sleeve and redeploy into an equal-weight completion future plus a 2-yr-10-yr Treasury flattener, a structure that profits if long-end yields rise on fiscal crowding-out triggered by mega-cap borrowing. The overlay keeps aggregate equity beta unchanged but raises exposure to the cap-ex diffusion factor by roughly 0.15 vol, enough to harvest 30-40 bp of annual alpha under our baseline scenario where mid-cap cap-ex grows 5 pp faster than mega-cap through 2026.
Stress tests using the 2013 taper episode show the basket would have outperformed by 280 bp during the five-month yield backup, while the flattener would have added 90 bp, cushioning the fixed-income leg.
The Fed’s Next Move: A Cap-Ex Sensitivity Shock
Fed Funds futures now price 42 bp of cuts by March 2026, but the dispersion across FOMC dots is 65 bp, the widest since 2016. A hawkish reprice would raise the real user cost of capital fastest for the long-duration cap-ex cohort, amplifying the concentration risk already embedded in cap-weight indices. Conversely, an insurance-cut scenario steepens the curve, aiding mid-cap borrowers who fund at the short end. Our model implies that every 25 bp of curve steepening transfers roughly 15 bp of relative cost advantage from mega-caps to mid-caps, a flow that equity baskets historically price within six weeks. Watching the slope, not the level, of yields is therefore the cleanest real-time signal for rotating cap-ex exposure.
Bottom line: the 42 % cap-ex concentration is no longer a headline; it is a systematic risk factor that changes the covariance between growth, duration and equity premium. Models that fail to isolate the factor are effectively long a call option on mega-cap cap-ex efficiency at a time when marginal returns are rolling over. A neutral-beta tilt toward the diffusion leg of the cycle offers a cleaner risk-adjusted path to capturing the next leg of U.S. expansion.
For deeper factor decompositions, quarterly risk-premium dashboards and model-ready covariance matrices that isolate cap-ex concentration beta, see the full allocation toolkit here.