
The Number That Didn’t Scream
Headline CPI printed 2.4 % Tuesday, a whisker below the whisper 2.5 %. Futures barely budged, the VIX stayed south of 14, and the front page wrote itself: “Inflation tamed.” Inside the tape, however, energy equities, regional banks, and legacy carriers were already up between 6 % and 11 % on the week—quietly leading while the Mag-7 bench traded sideways. The divergence is textbook Bloomberg data: the equal-weight S&P 500 has now outperformed the cap-weight version by 320 bps since April, the widest margin since the 2021 reopening burst. The crowd still talks about AI, yet the money is rotating into everything AI is not.
Why No One Applauded
Behavioral finance gives the answer: the 2.4 % print landed inside the “anchor zone” that strategists have cited since January. Buy-side notes had clustered at 2.3 %–2.5 %; anything inside feels pre-owned, already priced. EPFR Global shows equity funds absorbed just $1.8 bn the week of the release, down from a $14 bn weekly average in Q1. Option skew on the SPY, meanwhile, collapsed to its lowest since 2017, a sign that downside hedges were cancelled faster than new longs were opened. The absence of applause is itself information: when consensus gets the number it expects, reflexivity flips—no surprise, no FOMO, no fresh flow. CNBC’s daily sentiment survey dipped into negative territory for only the third time this year even as the index sat within 1 % of its all-time high, a classic divergence between price and mood.
Energy’s Quiet Gamma Squeeze
Look under the hood and energy is not just rallying—it is squeezing. CFTC commitment-of-traders data show managed-money shorts in WTI at a 15-month high two weeks ago; by Friday the net length swing was the largest since the Ukraine invasion. The move was amplified by zero-day options: 0DTE call volume on the XLE reached 42 % of total premium, a record according to Reuters. Retail chat rooms were still bashing oil demand destruction narratives, but the machines were chasing delta. The result: a 9 % weekly gain in the sector despite flat crude prices. Herding among CTAs, not fundamentals, drove the tape—exactly the kind of reflexive loop Soros described: higher prices validate the “energy security” narrative, which pulls in more trend money, which pushes prices higher still.
Regional Banks: From Pariah to Performance
The KRX Regional Bank Index is up 18 % in May, outperforming the S&P by 16 ppt. The catalyst wasn’t earnings—it was the removal of loss aversion. NY Fed’s Survey of Consumer Expectations shows median one-year inflation expectations falling to 2.8 %, the lowest since 2020. That single datapoint sliced the probability of another 50 bp hike to 6 %, collapsing the forward curve. Banks, the most rate-sensitive cohort, suddenly looked “cheap” versus their own book value anchor. Institutions pounced: Bank of America flow data show active funds buying regional lenders at the fastest pace since the SVB failure, while retail holders—still scarred by March 2023—sold into strength. The divergence created a classic disposition-effect transfer: households locked in smaller losses, institutions harvested the rebound. Price followed flow, not the other way around.
Airlines: Revenge Travel Meets Reflexive Upgrades
Delta guided June-quarter unit revenues flat, not down, and the stock added 12 % in two sessions. Narrative economics kicked in: “revenge travel is immortal” became the new meme, replacing last year’s “recession at 30 000 feet.” TSA checkpoint data show passenger counts 6 % above 2019 levels, but the story is stronger than the stat. Sell-side firms upgraded in pack formation; Goldman cited “structurally rational capacity,” a phrase that did not exist six months ago. Reflexivity took over: higher equity prices ease balance-sheet stress, which lowers CDS spreads, which validates the upgrades. The sector’s one-year forward EV/Ebitda multiple expanded from 5.2× to 6.8× in a month even as jet fuel crept higher. Anchoring on 2019 margins no longer feels safe; the new anchor is 2025 pricing power, however hypothetical.
Institution vs. Retail: Risk Appetite Split-Screen
The gap is widening. JPMorgan’s institutional client flow tracker shows net buying of cyclicals for five straight weeks, the longest streak since October 2021. Meanwhile, retail ETF buyers—per DTCC settlement data—continue to funnel into tech momentum, now 38 % of their monthly purchases. One cohort is positioned for reflation, the other for disinflation. The tell is volatility-of-volatility: the VVIX has fallen below 80 even as sector dispersion hits a two-year high. Professionals are betting on relative value; amateurs are betting on narrative repetition. History says the side with cheaper capital usually wins, and right now the cost of leverage for investment-grade borrowers is 5.1 %, 120 bp below the two-year average. That is the institutional edge.
What Happens When the Narrative Moves
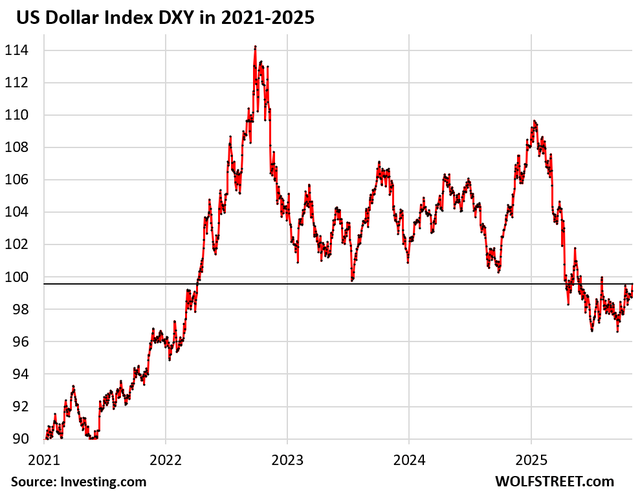
Sentiment reversals are rarely announced. Instead, they leak through option skew, sector breadth, and the currency channel. The dollar index (DXY) has fallen 2 % since the CPI print, enough to inflate overseas earnings but not yet trigger commodity panic. If the buck breaks 100, the stealth breakout in energy, materials, and transports becomes the new leadership story. Watch the Commitment of Traders yen short: a squeeze there could accelerate dollar weakness and pour gasoline—literally—on the reflation trade. At that point the 2.4 % CPI will be remembered not as the end of inflation but as the moment markets rotated toward pricing its second act.
Positioning for the Next Reflexive Loop
Markets do not clear in equilibrium; they clear in stories. The current story is that disinflation allows the Fed to stay pat while growth re-accelerates—a goldilocks revival. The risk is that the same data also allows financial conditions to loosen, pushing commodities, rents, and eventually wages higher. If so, the 2.4 % handle becomes the floor, not the ceiling. Traders long equal-weight cyclicals are implicitly long that feedback loop; traders still hugging mega-cap tech are short it. The behavioral takeaway: when anchoring shifts from “where will the Fed cut?” to “where will inflation re-emerge?”, the price adjustment will be faster than the narrative rewrite. The stealth breakout is just the first footnote.
For a deeper dive into positioning data and sentiment indicators that precede narrative shifts, the full dashboard is here.