
The Capex Ledger No One Sings About
Between January 2023 and March 2025 the five largest U.S. cloud providers spent $195 billion on AI-dedicated silicon, data-hall real estate and the dark fiber that laces it together, Bloomberg calculates from quarterly filings. That figure eclipses the combined 2024 R&D budgets of the S&P 500’s bottom 240 members. Yet aggregate revenue directly tied to generative AI over the same stretch—defined as sold-through inference, fine-tuning and model-hosting—amounts to only $29 billion, most of it booked as pass-through cost with mid-single-digit gross margin. The gap is no secret, but the market keeps widening it: capex guidance for 2026 was lifted another 18 percent in the April conference calls even as CFOs admitted pricing “headwinds” into 2027. Herding is easiest when everyone wears the same sneakers.
Reflexivity in the Age of Narrative EBITDA
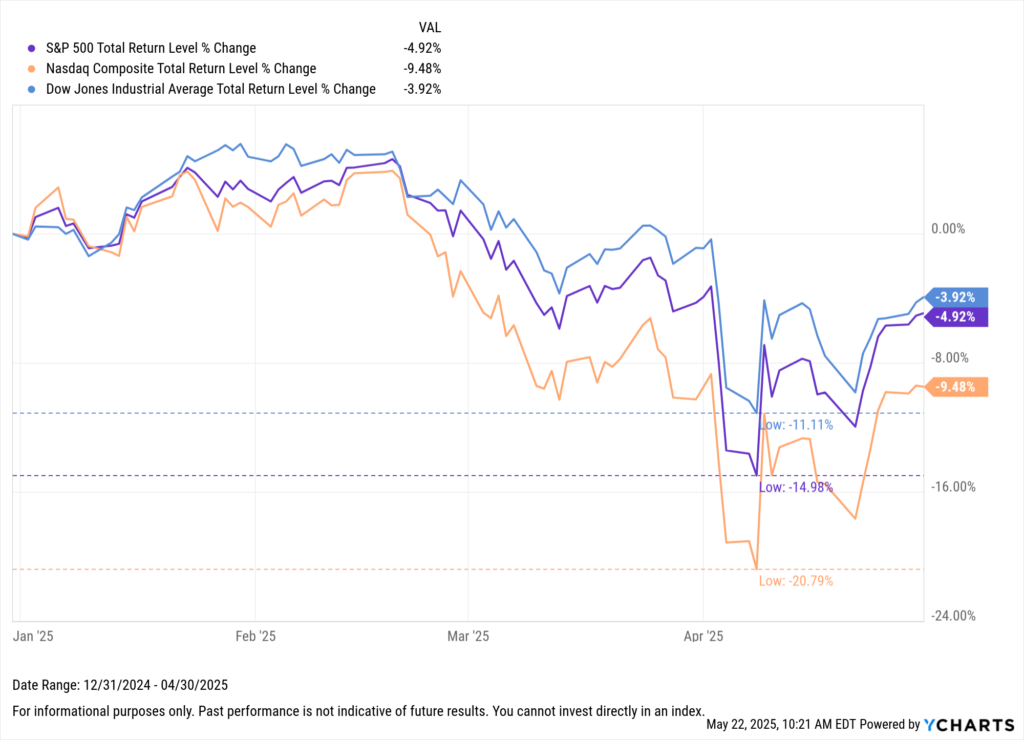
Equity analysts once anchored on EV/Ebitda; now they anchor on “AI-attributable TAM,” a number no one can audit until 2028. The shift matters because the same stocks—MSCI USA I.T. Index members—have doubled their weight in pension return targets since 2022, Federal Reserve Financial Accounts show. When the benchmark itself is the justification, every buy-order validates the story, a textbook loop George Soros would recognize. The result: information-insensitive flows. EPFR data indicate that tech-sector funds absorbed $62 billion of net new money in the first four months of 2025, the fastest start since the 2000 dot-com record, while daily volatility on the equal-weighted Nasdaq-100 sank to 11-year lows. Crowded calm is still crowded.
Institutional Delta vs. Retail FOMO
Look under the calm and you see two different clocks. CFTC positioning shows asset-managers short 2.4 million Nasdaq-100 e-mini contracts, a five-year high in delta-adjusted terms. Meanwhile, the retail-facing Magnificent-7 call-option volume running through zero-day expiry has risen 38 percent quarter-over-quarter, CNBC reports. Professionals hedge the mirage; amateurs insure they won’t miss it. Loss aversion is asymmetrical: institutions fear benchmark risk, individuals fear being left out. The split explains why earnings-day moves still exceed implied volatility even as 30-day realized vol drifts lower—someone always wakes up first.
Discount-Rate Repricing Is Already Underway
Markets rarely wait for the income statement to confess. The Conference Board’s May survey showed expected 12-month revenue growth for tech firms at 9.2 percent, down from 12.4 percent in February, yet the sector’s forward P/E has only compressed from 29.4× to 28.1×. Anchoring keeps multiples sticky, but bond math is merciless. The two-year Treasury yield at 4.78 percent implies a 370-bp real rate when deflated by the NY Fed’s underlying inflation gauge, the highest since 2007. Every 50-bp rise in the real discount rate slices roughly 8 percent off a zero-coupon equity whose cash flows are assumed to arrive after year seven—precisely the profile baked into AI-centric names. The market knows the schedule; sentiment just hasn’t boarded the bus.
When Revenue Becomes a Preference, Not a Promise
Confirmation bias loves leading indicators that can’t yet be disproven. CIO surveys from Reuters indicate that 71 percent of Fortune-500 executives plan to “pilot” generative-AI tools in 2026, up from 58 percent for 2025, but actual budget allocations average just 0.9 percent of IT spend. Pilots rarely trigger vendor profits; they buy time for storytelling. If adoption curves follow the Gartner hype cycle rather than a classical S-curve, the $195 billion sunk by cloud kings could hit a wall of “preference” rather than purchase orders. ROIC, already sliding from 19 percent in 2022 to an estimated 11 percent for 2025, would then approach the 8 percent weighted-average cost of capital most firms assign to their data-center fleets. The equity risk premium would compress not because risk fell, but because return did.
The First Crack in the Narrative
Reflexivity works in reverse, too. In April a mid-cap SaaS name pre-announced a $20 million shortfall in its AI-copilot module, citing “elongated procurement cycles.” The stock dropped 34 percent in two days, but the read-across hit the hyperscalers just as hard: $240 billion of combined market cap evaporated, although their guidance stayed intact. That is sentiment arbitrage—one earnings letter re-priced an entire TAM assumption. Loss-aversion selling spread to suppliers: the PHLX Semiconductor Index underperformed the S&P 500 by 520 bp the same week despite no new chip data. When narratives fracture, the market punishes first and verifies later.
Where Capital Turns Next
Watch fund-flow velocity, not headlines. Since the SaaS warning, weekly tech inflows have slowed to $1.8 billion from a $4.2 billion run-rate, EPFR shows, while energy and industrial sectors absorbed $3.5 billion combined, their best five-week streak since early 2022. The rotation is still modest, but it signals a risk-appetite shift from growth duration to cyclical cash. If AI revenue fails to inflect by the second-quarter 2026 reporting cycle, the same reflexive engine that levitated the cloud kings could accelerate their multiple contraction. A 28× P/E can become 20× in three weeks when the story changes; the $195 billion of concrete already poured cannot.
Investors who lived through the fiber glut of 2001 know how this movie ends: oversupply, price wars, and a wave of asset write-downs that finally force the market to distinguish between builders and beneficiaries. The difference this cycle is the scale of the bet—AI capex now equals 1.2 percent of U.S. GDP—and the depth of the narrative embedding. When numbers no longer support the dream, behavior must adjust. The only question is whether the reckoning arrives in 2027, or whether a single disappointing guidance night pulls the curtain forward by twelve months. Either way, the cloud kings still own the bill.
For those mapping how narrative shifts translate into factor performance, a deeper behavioral dataset is available here.