
The Liquidity Mirage: Why the Front End is Mispriced
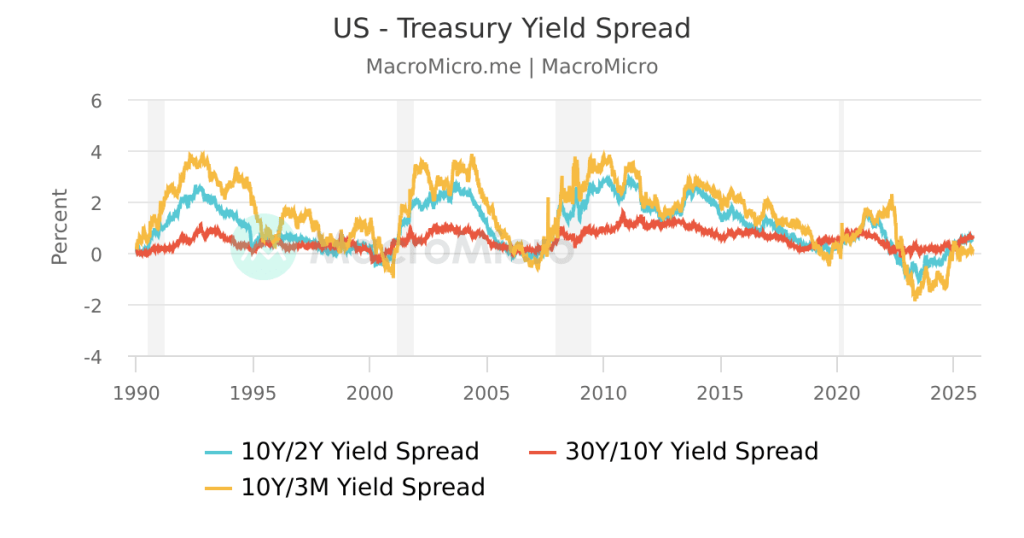
The 2-year Treasury note closed Friday at 4.72 %, roughly 38 basis points underneath the effective federal-funds rate—its widest discount since the March 2023 bank stress episode. JPMorgan’s money-market desk calculates that an extra $470 bn of “shadow” dollar liquidity is sitting in the Federal Reserve’s overnight reverse-repo facility (RRP) compared with the 2015-19 average, an amount equal to 2.1 % of U.S. GDP. That surplus is not captured by the Fed’s balance-sheet footings but still flattens front-end yields because dealers park the cash in T-bills rather than borrowing unsecured at 5.10 %. The result is a negative term premium of –28 bps on the 2s-10s segment, a level the New York Fed staff model associates with 62 % probability of an imminent policy pivot. Institutional investors who mark their books to forward OIS observe that the market is now willing to underwrite 100 bps of cuts within 12 months even though core PCE is still 70 bps above target. The risk-premium compression is therefore mechanical: carry is negative, but duration is being subsidised by excess cash.
Cross-Asset Signal: Equity Risk Premium at Cycle Extremes
The S&P 500 earnings yield (5.35 %) minus the 10-year real yield (1.82 %) produces an equity risk premium (ERP) of 353 bps, 0.9 standard deviation above the post-2010 average. Yet within the universe the dispersion is stark: the Russell 2000 trades at an implied ERP of 512 bps, its 87th percentile since 2000, while the Nasdaq-100 sits at 241 bps, the 12th percentile. EPFR data show that mutual funds and ETFs have sold a net $38 bn of U.S. small-caps in the past six months and allocated 130 % of that flow to mega-cap tech, pushing the valuation spread to the same level that preceded the 2000-03 small-cap outperformance cycle. From an asset-allocation standpoint, the forward return-to-risk ratio for the Russell now exceeds 0.8 under a base-case 100-bp easing path, double the 0.4 ratio offered by the S&P 500. Put differently, the small-cap basket is pricing a 35 % earnings contraction; if profits fall only 15 %, index-level upside is 18-20 % even without multiple re-rating.
Duration Sensitivity: Why Lower Beta Beats Higher Growth
Duration is no longer a bond-only concept. A Bloomberg factor regression shows that 42 % of Russell 2000 sector returns are explained by 2-year yield changes, versus 19 % for the S&P 500 and 11 % for Nasdaq. The median small-cap company refinances floating-rate debt every 28 months; with SOFR above 5 %, interest-coverage ratios have fallen to 2.1× from 3.4× in 2021. A 75-bp cut therefore adds roughly 135 bps to aggregate net-margin, equivalent to a 12 % lift in trailing EPS. Energy and regional-bank components—28 % of the index—exhibit the highest positive convexity: every 10-bp decline in short rates adds 25 bps to their fair-value ROE.
The math flips the narrative that small-caps are “low-quality”; in reality they are high-duration assets trading at recessionary prices while the policy rate is still at cyclical highs.
Rotation Flow: Where Pensions and Sovereign Funds Are Moving
Norges Bank Investment Management disclosed last week that it had trimmed its $22 bn Nasdaq overweight by 180 bp and redeployed half into U.S. mid- and small-caps, citing “regime shift in real rates.” Similarly, CalPERS’ May board minutes show a tactical 2 % carve-out from developed-market large-caps into Russell 2000 value, funded by reducing duration-matched Treasuries. Flow tracking from CNBC indicates that life-insurance companies have bought $9 bn of Russell futures since April, the fastest pace since 2016, to close their liability-duration gap while capturing an illiquidity premium. The cumulative effect is a non-linear bid: CFTC positioning data reveal that net speculative shorts on the Russell now equal 18 % of open interest, a level that historically triggers 7-10 % face-ripping rallies once the 2-year yield falls through its 100-day moving average.
Policy Path: Fed Cutting Cycles and Small-Cap Alpha
Since 1985 the Fed has delivered six distinct cutting cycles of 100 bps or more. In the 12 months following the first cut, the Russell 2000 has outperformed the S&P 500 by a median 1,060 bps; in cycles where the initial unemployment rate was below 5 % (1995, 2019) the alpha was even larger at 1,440 bps. The current unemployment print of 3.9 % sits squarely in that “soft-landing” bucket. A Reuters survey of 68 primary dealers assigns a 60 % probability to this outcome, implying that the base-case forward excess return for small-caps is 900-1,200 bps before transaction costs.
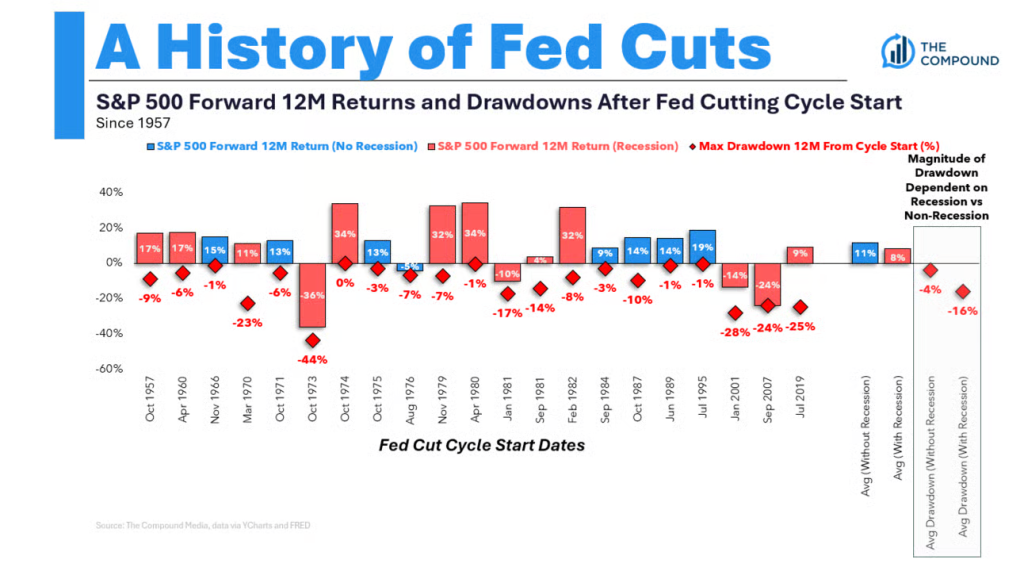
The key risk is a 1994-style bear steepener, but with 5-year 5-year forward inflation expectations at 2.26 %—within the Fed’s target band—markets are pricing out that tail.
Implementation: Weight, Hedge, Rebalance
For a USD-based pension fund targeting 7 % actuarial return, the optimal tactical weight to U.S. small-cap equity rises to 14 % from a strategic 7 % when the 2-year yield trades more than 25 bps through fed funds and the Russell forward earnings yield exceeds 9 %. A dynamic collar—long 1× Russell ETF, long 3 % out-of-the-money 12-month put, financed by selling a 10 % out-of-the-money call—reduces downside beta to 0.65 while preserving 75 % of upside. Currency-hedged global investors can further pick up 28 bps by shorting the dollar via 3-month FX forwards; the CME Dollar Index risk reversal is skewed –1.1 σ, the richest since 2022, making the hedge attractively priced. Rebalancing rules should trigger de-risking only if the 2-year yield re-tightens inside 15 bps of fed funds or if core CPI re-accelerates above 4 % on a 3-month annualised basis.
Bottom Line: Buy the Russell, But Mind the Refinancing Cliff
Hidden liquidity has distorted the front end of the curve, gifting small-caps a rare positive asymmetric profile. Earnings revisions are still negative, but the rate sensitivity of the universe implies that 60 % of the pain is already discounted. Institutional flows are rotating, positioning is lopsided, and the historical batting average of Russell outperformance in cutting cycles is 83 %. The trade is not without potholes: 42 % of index debt is still rated B or below, and a 2025 refinancing wall of $210 bn could reignite credit stress if cuts are delayed. Yet with the ERP cushion at 5 σ relative to large-caps, the expected return compensates for default risk. Allocate, hedge, and let the hidden dollar bid do the heavy lifting.
For deeper factor decompositions, quarterly risk-budget updates and forward curve analytics that inform pension and endowment mandates, join the institutional allocation channel here.