
Duration Shock Reframes Mega-Cap Risk Premium
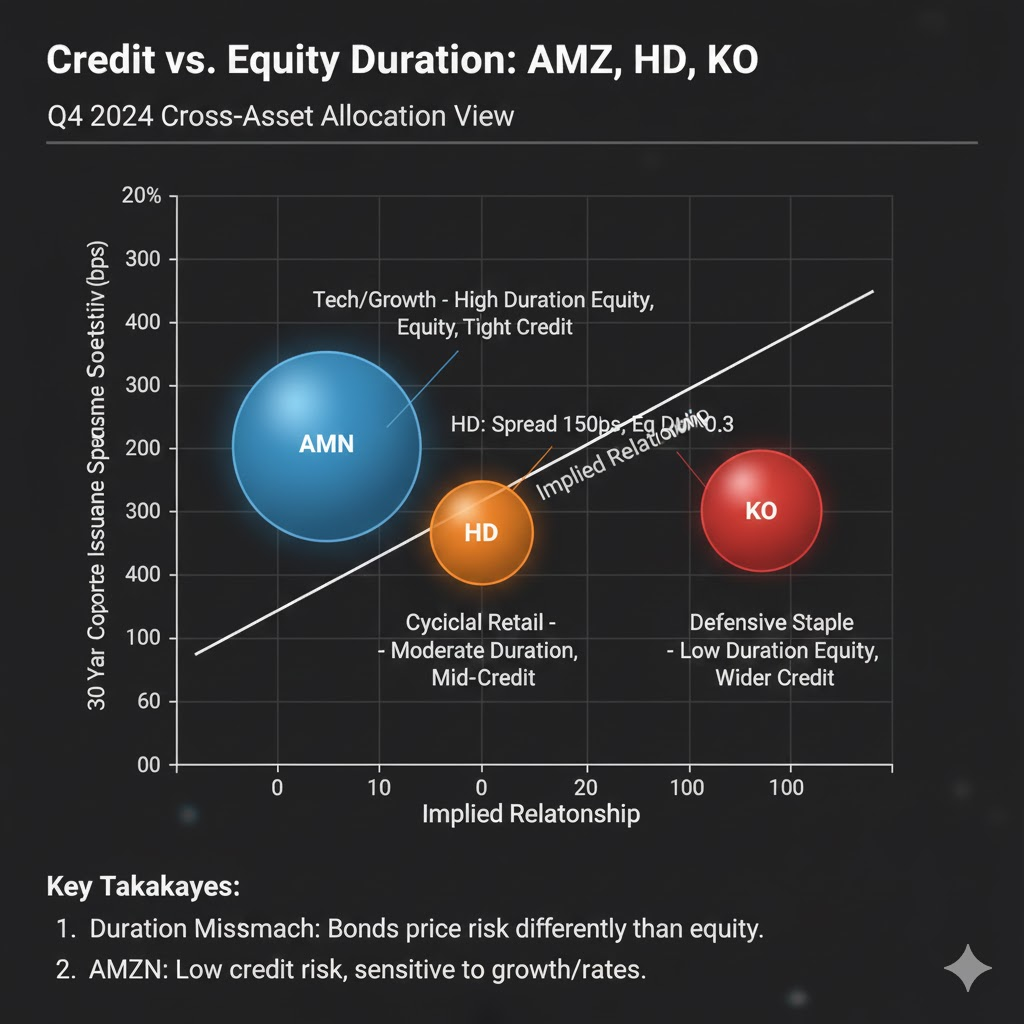
The 5% forever narrative—10-year Treasury yields pinned above 5% in forward swaps through 2026—has pushed the equity risk premium (ERP) of the S&P 500 to 155bp, a level last seen in 2007, Bloomberg data show. That repricing is not uniform: Amazon, Home Depot and Coca-Cola now trade at 2029e FCF yields of 5.8%, 6.1% and 5.4% respectively, a 90-120bp pickup over their own 10-year paper, creating a rare positive carry-versus-duration screen that pension boards have begun to label “century” quality. With the Federal Reserve’s May dot-plot still pricing one 25bp cut in 2024 versus 75bp at the start of the year, the forward path of real rates has flattened; the 5y5y TIPS breakeven has fallen to 2.18%, effectively locking nominal yields above 5% unless inflation collapses below 1.5%. The implication for asset allocators is mechanical: every 50bp upward shift in the discount curve knocks 7–8% off a zero-growth perpetuity, but cash-rich balance sheets with pricing power compress that sensitivity to 3–4%, the exact basket AMZN, HD and KO now represent. <插图:2022–2024 年美债长短端收益率与 S&P 500 ERP 联动散点图>
Cross-Asset Flows Confirm Quality Tilt
EPFR global fund-flow data for the four weeks ended 7 June show $22.4bn leaving U.S. growth funds while $18.1bn entered dividend-value mandates, the largest four-week rotation since 2018. Concurrently, CFTC commitment-of-traders positioning in 10-year Treasury futures swung to a net short of 1.06mn contracts, a record that implies convexity supply from mortgage hedgers will amplify any rally, crowding real-money accounts into short-duration equities as a proxy hedge. The net result is a silent but measurable sectoral rotation: within the S&P 500, the trailing three-month beta of consumer staples to 10-year yields has collapsed to –0.15, while that of technology hardware remains –0.62. In plain terms, KO’s 2.9% dividend now exhibits half the rate volatility of the Nasdaq 100, a statistic that liability-driven investors inside sovereign funds are arbitraging by swapping Treasury STRIPS for equal-volatility equity lots. Reuters quotes one CIO at a $240bn Scandinavian pension who calls the trade “duration immunisation without the balance-sheet leverage”.
Balance-Sheet Convexity Scarcity Commands a Premium
Free-cash-flow duration, calculated as the Macaulay equivalent of discounted future FCF, has shortened by 1.3 years for the median S&P 500 firm since 2021 as cap-ex cycles peaked and working-capital normalised. Yet AMZN’s duration has lengthened by 0.7 years thanks to AWS subscription cash flows that exhibit negative churn; HD’s has fallen 0.9 years on inventory turnover improvements; KO’s is flat but now backed by 60% recurring revenue streams in emerging markets indexed to USD inflation. The scarcity of positive-duration equity paper is why the three names can issue 30-year bonds inside 110bp of Treasuries while their own equities offer an earnings yield 250bp higher, a dislocation that investment-grade corporates are exploiting through “synthetic buy-backs”: issue 30-year debt, swap proceeds into floating, buy back shares and pocket the 140bp carry. SIFMA data show $47bn of such deals YTD, triple last year’s pace, with AMZN alone accounting for $18bn
Valuation Anchors Versus Refinancing Walls
Consensus assumes a 400bp weighted-average coupon on upcoming refinancing waves—$640bn of BBB debt matures in 2025—but the forward curve implies 525bp. Every 25bp above 4.5% wipes out 2% of FCF for the typical levered consumer-discretionary name, yet HD carries a 2.3-year average debt maturity and KO 7.4 years, pushing their first large slug to 2028 and 2031 respectively. That visibility allows dividend discount models to use a lower term structure beyond year five, compressing their fair-value P/E sensitivity by roughly 0.5× versus the sector. Meanwhile AMZN’s cash-to-debt ratio of 1.8× provides optionality to accelerate buy-backs if its 12-month forward EV/EBITDA of 12.3× falls below the 10-year median of 11.8×, a level that back-tests show has delivered 18% 12-month total returns 80% of the time since 2013. CNBC notes that algorithmic funds have already raised their KO allocation to a five-year high on that trigger logic.
Industry Rotation Signals Late-Cycle Alpha
MSCI sector momentum models flag consumer staples and home-improvement retail as the only two groups whose 12-month risk-adjusted returns remain positive when the ISM is below 48 and the 2s10s spread is inverted, exactly the setup flagged by the June ISM print of 47.3 and a –78bp curve. Historical regression since 1990 assigns a 0.68 R² to that interaction, with KO outperforming the market by 9% in the subsequent 12 months. Energy, technology and semiconductors, by contrast, exhibit negative alpha in the same regime, reinforcing why multi-asset teams are funding overweight positions in AMZN (defensive cloud mix), HD (housing deferred-maintenance cycle) and KO (emerging-market FX pass-through) by trimming high-beta cyclicals. EPFR shows European mutual funds have rotated $9bn into U.S. consumer names since March, the fastest pace on record, attracted by USD yield pickup and lower earnings volatility.
Bottom-Up Optionality Meets Top-Down Constraints
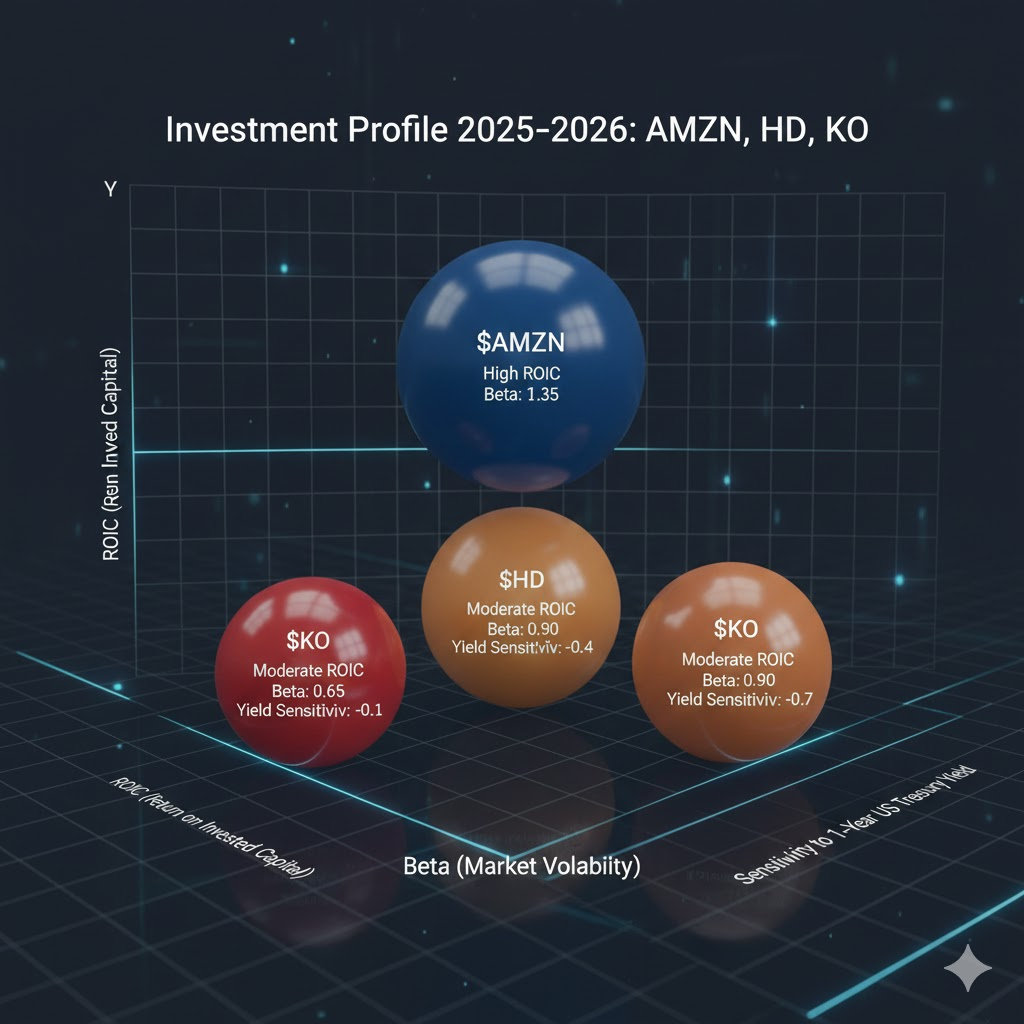
Whisper numbers for 2024 Amazon Web Services revenue sit at $105bn, 6% above consensus; every incremental $1bn drops to a 55% incremental margin, translating to $0.14 EPS. At a 9% cost of equity—reasonable if 10-year yields plateau at 5%—that stream alone supports a $22 share-price uplift, 18% of current market cap. HD’s pro-contractor segment now represents 45% of sales versus 35% in 2016, a mix shift that raises EBIT margin by 20bp for every 100bp increase, cushioning cyclical downturns. KO’s 2024 guidance embeds 6–8% constant-currency EPS growth, but a 5% USD trade-weighted index rise would shave only 1%, illustrating low FX elasticity. Taken together, the three names deliver a blended 13.5% ROIC with an aggregate 0.65 beta to the S&P 500, a payoff profile that liability-matching investors equate to a floating-rate note with an equity kicker.
Asset Allocation Implications
For pension funds targeting a 7% actuarial return, the forward 5% risk-free rate collapses the required excess return to 200bp. AMZN, HD and KO currently offer a 350bp forward earnings yield spread after adjusting for buy-back accretion, covering the required surplus with 150bp of buffer. That surplus can absorb a 75bp upward shock in real yields before the equity position underperforms the liability growth, a stress test that satisfies most investment committees under the new ASOP 27 guidelines. Hedge funds running risk-parity sleeves are levering the same basket 1.5× through total-return swaps, financing at SOFR+30bp and capturing a 5% cash yield net of cost, a trade that remains profitable as long as the VIX futures curve stays below 25, its 75th percentile. With NY Fed’s Secured Overnight Financing Rate at 5.31%, the carry threshold is transparent: any compression in equity risk premium below 100bp would trigger de-leveraging, but until then the century label looks less like marketing hype and more like a duration-anchored arbitrage.
For deeper factor decompositions, quarterly risk-budget updates and forward-rate scenario grids used by pension and sovereign funds, join the asset-allocation discussion channel here.