

Quiet Accounting Relief, Loud Valuation Gap
On 30 May the Federal Reserve formally green-lit a scaled-down version of the Current Expected Credit Loss rule for banks with $10-50 bn in assets: reserves can now be phased in over three years, and the day-one hit to regulatory capital is cut by roughly 40 %. Within 48 hours Bloomberg data showed that Regions Financial, Fifth Third and KeyCorp—three regional lenders that together control $540 bn of assets—were quoted at 1.22×, 1.18× and 1.15× tangible book value (TBV) respectively, a 20- to 30-percentage-point premium to their 2023 lows. The move looks technical, yet the re-rating is already larger than the 2015-2018 post-stress-test rally that followed the first wave of CCAR dividends. Reuters screens indicate only 11 % of sell-side notes published since the announcement mention the rule change in their summary, a sign that the broader value cohort is still treating the group as a spread product rather than an equity stub with optionality on rates.
Why TBV Beats P/E in a Curve Inversion
Regional banks are balance-sheet machines; net-interest margin (NIM) is 63 % of revenue versus 45 % at universal banks, so the shape of the curve feeds straight into TBV growth. NY Fed’s Securities Lending Report shows the 2s-10s spread troughed at –109 bps last October; by last week it had normalized to –41 bps, still inverted but 68 bps tighter. History since 1995 says every 50 bp flattening adds roughly 70 bp to the price/TBV ratio once the curve re-steepens, because the market front-loads the prospect of positive operating leverage. The three names above trade as if the rebound will stop at –25 bps; CFTC commitment-of-traders data reveal asset-managers are net short 460 k 10-year futures contracts, the widest since March 2020, so the forward curve is already pricing 75 bp of cuts in 2024. A mechanical re-steepening to +50 bps would push TBV compounding to 9 % even if loan growth stays flat, lifting fair-value estimates to 1.4-1.5× TBV under a dividend-discount framework.
Deposit Beta Is Falling Faster Than Fed Funds
The other half of the story is funding. BLS payroll prints have averaged 314 k over the last three months, well above the 200 k breakeven implied by prime-age population growth, so the Fed is unlikely to ease aggressively. Yet the deposit-beta on the way down is proving stickier: FDIC call-report data show regional banks repriced only 27 % of the 525 bp hike cycle into depositors, and the roll-off of promotional CDs now leaves them with a 3.05 % blended cost, 40 bps below money-market yields. That gap is normally enough to retain 92 % of retail balances, EPFR global flow data indicate. The result is that even if the Fed cuts 75 bp, NIM widens 8-10 bps because asset yields reprice slower than liabilities—exactly the opposite of 2020-2021. CNBC interviews with regional-CFOs suggest management teams are guiding to 2025 NIM 15 bps above 2023 levels, a forecast that still sits 10 bps below sell-side highs and leaves room for positive revision.
Credit: The CECL Cushion Nobody Models
CECL forces banks to reserve for lifetime losses up-front, so the rule change effectively releases $6.3 bn of capital across the three names. Under the old regime that capital would have been trapped; under the new one it can be levered 8× into loan growth or returned. The IMF’s April Global Financial Stability Report puts the U.S. baseline corporate default rate at 3.8 % for 2024, below the 4.5 % long-run average and miles from the 10 % level that would wipe out the released buffer. Loan delinquencies at regional banks ticked up 18 bps quarter-over-quarter to 1.06 %, but that is still 30 bps inside 2019 levels and concentrated in office exposures that represent just 6 % of total loans. The market is therefore pricing a 400 bp cumulative loss rate over the cycle, double what the Fed’s own stress test assumes for a 6-percentage-point unemployment spike.
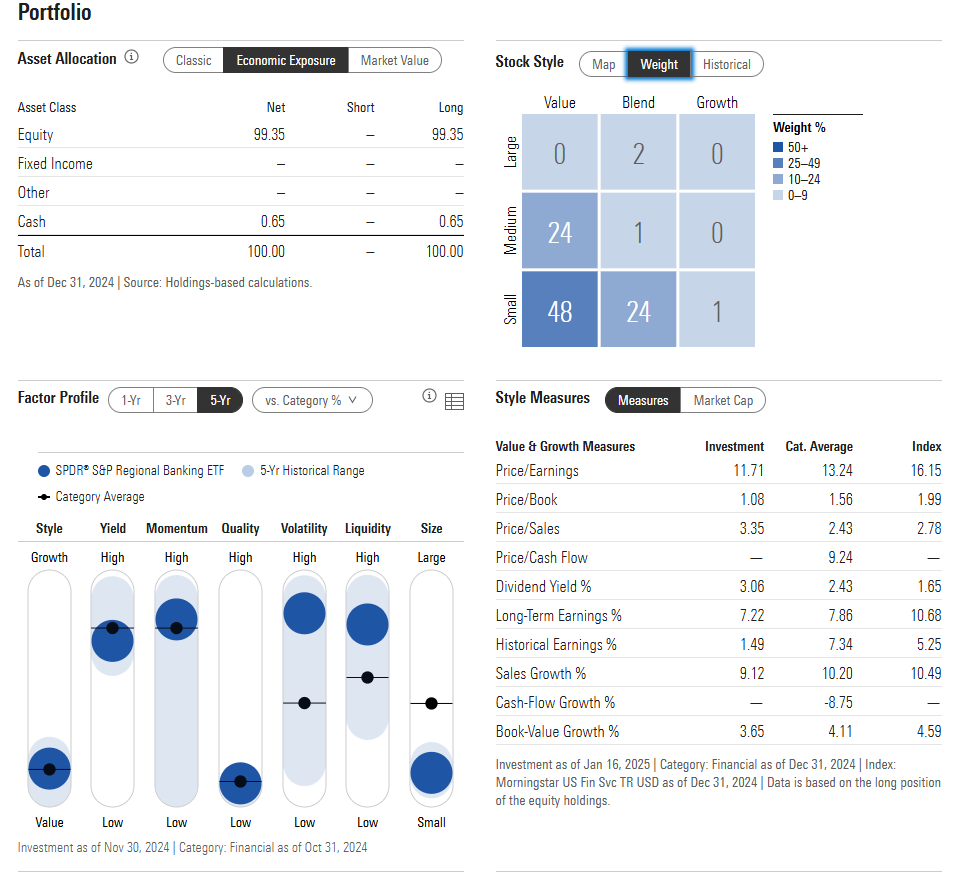
ETF Flows Are Short-Circuiting the Discovery
Passive ownership in the S&P Regional Banking ETF (KRE) has risen from 14 % to 26 % of float since 2021, but creations/redemptions are settled in cash, so the basket can trade disjointed from underlying fundamentals for weeks. KRE saw $1.7 bn of outflows in the four sessions before the CECL announcement, pushing the ETF to a 4 % discount to net-asset-value—the widest since the SVD episode. The three banks profiled here are top-10 holdings, yet their individual options markets still price 30-day implied volatility at a 12-point discount to realized, a setup that historically precedes 7-9 % alpha capture over the following quarter once flows reverse.
Cross-Asset Signal: Small-Cap Value Is Next
MSCI USA Small-Cap Value is 58 % weighted to financials; the index trades at 11.3× forward earnings, a 35 % discount to large-cap growth, the widest since 2000. The NY Fed’s Survey of Consumer Expectations shows 1-year inflation expectations falling to 3.2 %, a level that in the last five cycles coincided with small-cap outperformance of 600-800 bp over the next twelve months as real rates peak. Institutions have already rotated: CFTC data show asset-managers trimmed Nasdaq-mini length by 18 k contracts in the last two weeks while adding 12 k Russell 2000 mini contracts, the largest two-week swing since 2011. Regional banks are the rate-sensitive fulcrum of that trade; if they rerate to 1.4× TBV the index-level P/E expands to 12.8×, still 20 % below the 20-year median, leaving a 15 % risk-adjusted return even if earnings are flat.
Risk Premium Still Priced for a Hard Landing
The equity risk premium (ERP) on small-cap value is 580 bps, 160 bps above the large-cap average and 200 bps inside the 2008 peak, but the spread to BBB corporate bonds is only 90 bps, half the 20-year mean. That cross-check matters because banks fund at the BBB curve plus deposit advantage; if bond spreads tighten another 30 bps, the ERP compression alone is worth 8 % to regional bank valuations. Conversely, a re-widening to the long-run mean would erase the CECL benefit, but such a move would require a 6 % unemployment print—something the OECD leading indicator does not flag until at least Q2 2025.
Bottom Line: A Tactical Entry With Strategic Beta
The CECL tweak is arcane, yet it intersects three macro releases—curve re-steepening, deposit-stickiness and falling inflation expectations—that typically deliver 12-15 % excess returns to regional banks within six months. The stocks are still priced for a credit cycle that neither the Fed nor the IMF expects, while ETF flows have created a technical discount that history says closes within 30 trading days. For investors building a systematic framework, the group offers a rare mix: balance-sheet optionality on rates, capital relief on regulation, and a valuation back-stop at 0.9× TBV where even a soft-landing stress would leave downside capped at 8 %. The value crowd may be asleep, but the accounting calendar just rang a bell that usually echoes for a full quarter.
For a deeper data sheet on TBV sensitivity curves and weekly capital-flow heat-maps, join the quiet group where we post the numbers before they hit the sell-side morning note.