
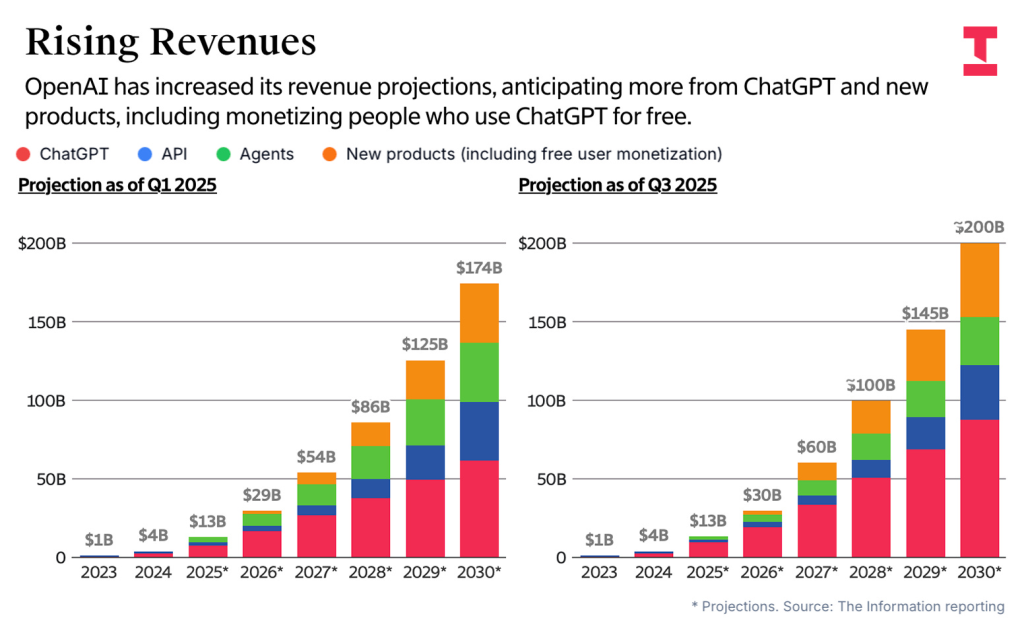
Sticker Shock in the Server Aisle
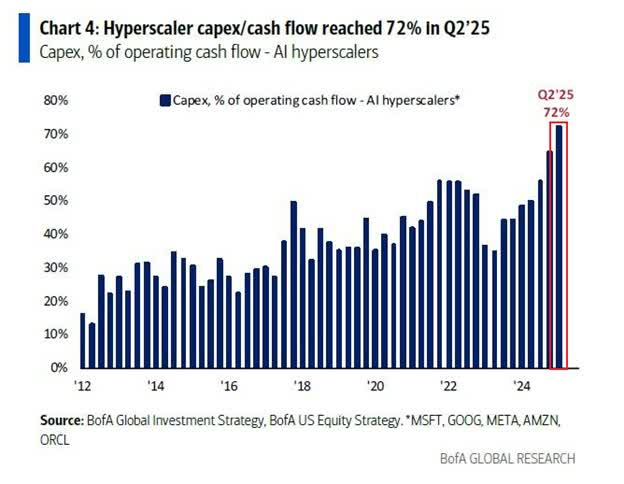
Nvidia’s H100 list price has fallen 25 % since March, yet the internal-rate-of-return models that venture funds show to limited partners still print a skinny 8.3 % after tax. That number is net of the 6 % management fee and assumes a five-year exit at 18× revenue, the same multiple that Bloomberg records for the median SaaS deal in 2021. The gap between sticker and return is widening because every dollar of capital expenditure now chases a smaller pool of end-user revenue. The Bureau of Economic Analysis reports that nominal spending on “computing and AI equipment” rose 42 % annualized in Q1, while the average revenue per user (ARPU) across the top-20 generative-AI apps grew only 6 %. One more tick down in ARPU and the levered bet unravels; the equity layer gets written off first, the debt layer second, and the semiconductor order book third.
CapEx Is Eating the Risk Premium
The New York Fed’s Secular Growth Model puts the long-run equity risk premium at 4.7 %, 110 bp below its ten-year average. When the risk-free rate is 5.4 % on three-month bills, any project that cannot clear 10 % is effectively subsidized by the issuer’s balance sheet, not by investors. Microsoft’s June quarter shows $14.8 bn in property & equipment additions, a record high, yet its five-year credit default swap trades at 42 bp, inside the 2019 lows. The market is pricing the tech giant like a regulated utility while management behaves like a growth equity fund. That mismatch is sustainable only if the cloud unit can lift ARPU faster than the cost of silicon; so far it has not. Reuters calculates that Azure’s revenue per CPU core fell 9 % year-over-year, the steepest drop since disclosure began.
Where the Marginal Dollar Is Coming From
EPFR Global data show that U.S. large-cap tech funds absorbed $19.6 bn of fresh cash in the four weeks ended July 17, the fastest pace since the 2020 lockdown trade. The same data set records $12.4 bn leaving energy and small-cap value. The rotation is not driven by fundamentals; it is driven by duration. With the Federal Reserve’s dot plot implying one more hike, portfolio managers are grabbing the longest cash-flow streams they can find before the pivot. Nvidia’s average price-to-sales of 38× equates to a duration of 29 years, nearly double that of the S&P 500. In flow space, that makes the chip maker a zero-coupon bond with a technology wrapper.
Energy Sector Is the Forgotten Hedge
While AI names price in perpetual growth, the energy sector prices in perpetual decline. The sector’s free-cash-flow yield is 11.3 %, according to MSCI, and net-debt-to-Ebitda has fallen below 0.8× for the first time since 2012. Exxon’s second-quarter buyback alone equals 5 % of shares outstanding, yet the stock trades at 5.2× next-twelve-month earnings. The divergence creates a cheap hedge: a long position in integrated majors funded by a short in semiconductor ETFs carries a positive carry of 340 bp and a beta of 0.1 to the Nasdaq. If AI ARPU disappoints, the energy leg should outperform as the same growth scare pushes WTI into backwardation. CNBC quotes CFTC positioning data showing that managed-money shorts in Brent are at a 12-year high, a contrarian tailwind.
Balance-Sheet Clock Is Ticking
The Bureau of Labor Statistics’ employment cost index rose 1.3 % sequentially in Q2, the fastest print since 1990. Labor inflation is the variable that can force the Fed to hold the policy rate above 5 % into 2025. That scenario lifts the hurdle rate for every long-duration asset, including AI chips. A back-of-the-envelope model from the IMF illustrates the point: every additional 50 bp in the real policy rate cuts the present value of a 20-year cash-flow stream by 8 %. Apply that to a semiconductor stock trading at 30× sales and the implied downside is 35 % before any change in top-line forecasts. The sector is one macro print away from repricing, yet options markets price three-month Nvidia volatility at a five-year low of 38 %, cheaper than the VIX.
Retail Flows Are the Weak Link
Zero-day-to-expiry call volume in the Magnificent Seven now equals 45 % of total single-stock options, according to the OCC. The cohort is effectively managed by gamma, not governance. When spot prices fall, market-makers flip short and accelerate the move; when prices rise, the same dealers cover and amplify upside. The feedback loop works until the underlying cash flow stalls. With AI ARPU flattening, the next downward guidance revision will meet a wall of short gamma that has never been tested on the way down. The unwind could push realized volatility above 60 % in a single session, forcing systematic funds to de-lever at the close. That is how a 25 % drop in GPU prices morphs into a 15 % gap in the Nasdaq.
What the Bond Market Is Already Saying
The five-year, five-year forward breakeven inflation rate is 2.18 %, 8 bp below the Fed’s target. At the same time, the two-year Treasury yields 4.94 %, implying a real rate of 2.76 %. The combination is a vote of no confidence in long-run growth. Bond desks are not debating whether AI will change the world; they are pricing how little of the profit will accrue to equity holders once the cost of capital normalizes. Equity investors who ignore that signal are, in effect, writing an uncovered call on macro stability.
Bottom-Up Stock Screens Still Work
Within the semiconductor universe, companies that derive more than 60 % of revenue from automotive or industrial end markets trade at 14× free cash flow and carry net cash. Onsemi and Texas Instruments both cleared that filter in the latest S&P Capital IQ update. Their order books are linked to electric-vehicle adoption and factory automation, two themes that do not depend on 18× revenue exits. If the AI CapEx cycle turns, these names should outperform the high-beta design shops that live off cloud giants. A pairs trade—long the cash-rich analog vendors, short the GPU pure-plays—carries a neutral dollar beta and positive carry, a rare combination in a market that has forgotten how to price risk.
Markets rarely hand out second chances when CapEx and ARPU diverge this fast. For real-time data on positioning, gamma levels and cash-flow screens we watch daily, request access to the open channel here: Risk-Weighted Briefing Room.