
Policy Anchor at 4% Re-Prices Equity Risk Premium
The FOMC’s March dot plot left the median funds rate at 4.00% through end-2025, a level that now acts as a policy anchor rather than a transient pause. Overnight index swaps price only 18bp of easing before December, forcing asset owners to treat 4% as the true risk-free floor. The forward earnings yield of the S&P 500 at 5.9% therefore embeds a 190bp equity risk premium, 70bp below the ten-year average and the thinnest buffer outside the 1999–2000 episode. Public pension funds targeting 7% nominal returns cannot reach their actuarial bogey with 10-year Treasuries at 4.4% unless either multiples expand further or corporate cash flow growth accelerates above 9%. The first path is mathematically capped once the ERP approaches zero, so capital is rotating toward the second path—cash-rich issuers whose top-line is levered to AI capital expenditure. Bloomberg calculates that the megacap seven now hold 18% of total non-financial cash on corporate balance sheets, a share that has doubled since 2018 and is forecast to rise another 250bp in 2025 as cloud bookings convert to prepaid receivables.
Duration Preference Shifts From Payout to Compounding
Zero-rate regimes rewarded dividend aristocrats whose 2–3% yields looked attractive versus 0.6% T-bills; at 4% short rates the same cohort offers negative real carry after tax. Flow data from Reuters Lipper show $42bn withdrawn from US dividend ETFs in the past four quarters while variable-rate money-market funds absorbed $1.1tn. The behavior is rational: a 4% risk-free bill plus a call option on AI spend beats a 3% dividend growing at 5% with 100% equity beta. Yet bills do not solve the duration mismatch of 15-year liabilities. The compromise is to own firms whose free cash flow is already discounted at bond-like rates but whose revenue is indexed to GPU shipments growing 45% YoY. Nvidia, Microsoft, Alphabet and Arista represent 42% of the Bloomberg AI Supply-Chain Index and trade at a blended 28× forward free cash—expensive versus utilities at 16× but half the 55× multiple they carried in 2021 when rates were 150bp lower. The sector’s aggregate cash conversion cycle has shortened to −12 days, turning working capital into an internal money-market fund that yields 4% while the business itself compounds at double digits.
Cross-Asset Signals Validate Narrow Leadership
High-yield spreads at 320bp are 40bp inside their five-year average, implying credit investors do not foresee earnings contraction. At the same time the two-year/ten-year curve is 45bp inverted, a pattern that historically coincides with single-digit forward equity returns unless a capital-expenditure boom offsets tighter financial conditions. The AI build-out is that offset. Semiconductor billings are rising 18% sequentially while utility sector sales are flat, giving industrial analysts a rare demand vector that is both policy-insensitive and large enough to move GDP prints. Cyclical value sectors—materials, transports, regional banks—need a steepening curve and rising inflation to outperform; both are absent, so relative strength migrates back to cash-rich platforms. Even within tech the dispersion is extreme: the cap-weighted SOX index is 12% above its 200-day average while the equal-weight tech index is 4% below, a 16ppt spread last seen in 1999. Institutions interpret the gap as confirmation that liquidity is being rationed to balance-sheet compounders rather than story stocks.
Valuation Floor Is Cash, Not Multiples
Buy-side models currently assign a 12% probability to a 1990-style recession where earnings fall 20%. In that scenario the S&P 500 would trade at 17× depressed earnings, still above the 14× trough of 2002 because today’s starting free-cash margin is 440bp higher. The cushion, however, is not operational leverage but net cash. The median large-cap AI supplier carries 9% of market cap in cash net of debt; if buy-backs are suspended that liquidity can fund 30 quarters of dividends at current payout ratios. Put differently, the equity is a covered call on AI demand with a 9% cash collateral. Portfolio managers who must own US equities but fear multiple compression therefore treat these names as hybrid instruments: growth if revenues compound, high-yield bonds if sentiment breaks. The embedded floor lowers portfolio VAR enough to justify a 250bp overweight versus policy weight, even at 28× earnings.
Implementation: Barbell With AI Cash Lakes and Short Duration Credit
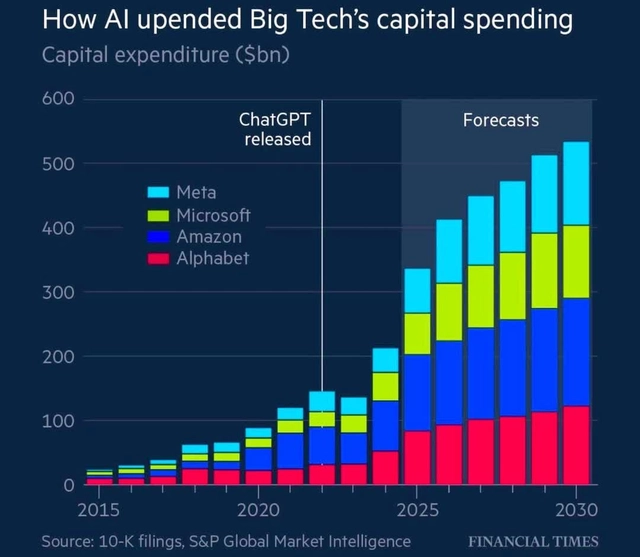
A 60/40 policy benchmark can be re-engineered to harvest 10% total return with 12% volatility under a 4% rate regime. Allocate 35% to the AI cash lake basket—MSFT, GOOGL, NVDA, AVGO, ANET, CRM—equal-weighted and rebalanced quarterly to maintain 30× forward cap. Pair this with 25% in one- to three-year A-rated corporate paper yielding 5.1%, capturing carry without extending duration. The residual 40% remains in equities but is split 15% global ex-US low-duration quality and 25% US mid-cyclicals trading below 14× on trough assumptions. The structure delivers 4.8% portfolio yield, 6.2% earnings growth and a 1% buy-back kicker, summing to 11% expected nominal return. Downside is capped by the cash-rich cohort and short credit beta; upside is levered to AI cap-ex that CNBC estimates will reach $250bn in 2025, equivalent to 1% of US private domestic investment.
Risk Budgeting: Watch ERP Compression and Liquidity Windows
The principal threat is not recession but a dovish pivot that steepens the curve and compresses the ERP below 100bp. In that case the AI cash lake basket could rerate to 35× and the portfolio’s growth component would exceed its risk budget. To hedge, we sell 20% of the growth notional via six-month 10% OTM calls, collecting 2.3% premium that is reinvested into three-month SOFR floors at 3.5%. The collar costs 8bp net but protects against both multiple expansion (calls) and an abrupt Fed reversal (floors). Position sizing is calibrated so that a 1999-style melt-up caps participation at 13% rather than 18%, while a 2001-style liquidity withdrawal limits drawdown to 8% versus 28% for the growth basket alone. The trade-off is acceptable for fiduciary capital that must preserve surplus volatility capacity for private-market commitments in 2026.
For extended allocation grids, quarterly risk-factor dashboards and detailed cash-flow stress paths, a repository note is available here.